

Last week brought good news on employment. Both private and government employers added 222,000 new jobs to the economy in June. This is the fourth time this year when employment has grown by at least 200,000 jobs in a single month. Although, it should be noted, the robust employment growth in June lags the same month last year, when jobs rose by 297,000.
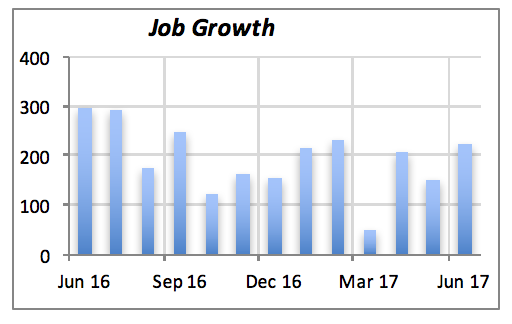
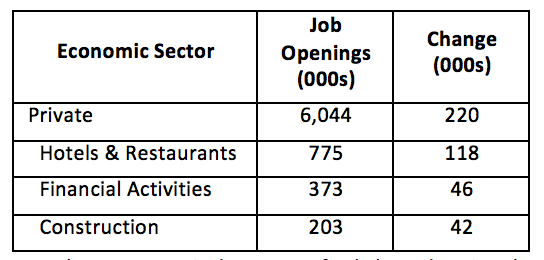
Even though the unemployment rate rose by one-tenth of a point to 4.4%, it still remains in what many consider full-employment territory. Labor markets are generally tight, with the number of job openings reaching a high of 6 million in April (the latest data available.)
The three areas with the largest change in job openings are “accommodation and food services” (i.e., hotels and restaurants in the table below), financial activities and construction. The inability to fill jobs in construction may be an underlying reason for the lack of growth in new housing starts.
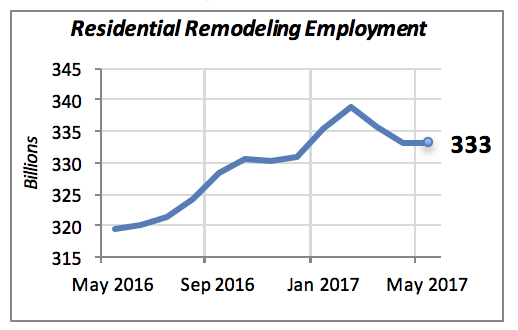
But closer to our industry, we find that, despite the general good news in overall employment, there was no change in the number of employees working for residential remodeling companies. For May, the latest data available, we find that 333,000 persons were employed in residential remodeling companies, the same as in the previous month.
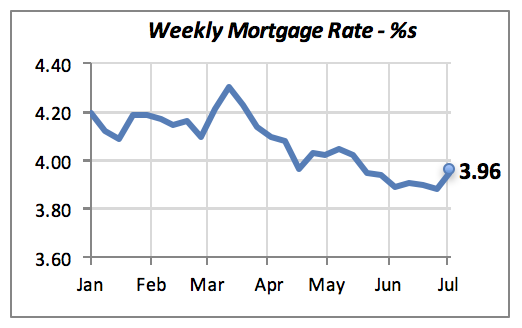
The fixed mortgage rate rose last week for the first time in several months. Although the move was only 8 basis points (i.e., eight-hundredths of a percentage point), it is moving in the wrong direction. Naturally, it is too early to tell whether this is just a temporary movement or the start of a trend driven by the Fed’s current policy of monetary tightening.
Manuel Gutierrez, Consulting Economist to NKBA
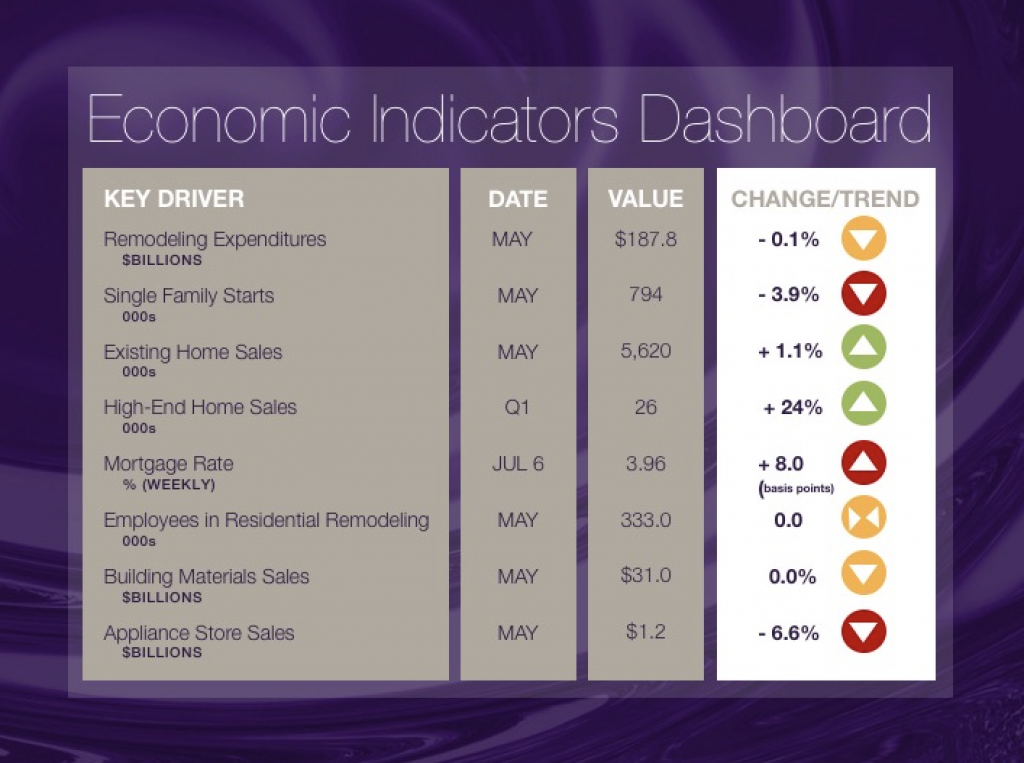
Explanation of NKBA’s Economic Indicators Dashboard
The dashboard displays the latest value of each economic indicator with a colored triangle that highlights visually the recent trend for each of the drivers. “Green” is a positive signal indicating that the latest value is improving; “Yellow,” as it’s commonly understood, denotes caution because the variable maybe changing direction; and “Red” indicates that the variable in question is declining, both in its current value and in relation to the recent past.
Note that all the data, except for “mortgage rate” and “appliance store sales” are seasonally adjusted and are represented at annual rates.
Remodeling Expenditures. This is the amount of money spent on home improvement projects during the month in question. It covers all work done for privately owned homes (excludes rentals, etc.). The data are in billions of dollars and are issued monthly by the U.S. Department of Commerce.
Single Family Starts. It is the number of single family houses for which construction was started in the given month. The data are in thousands of houses and are issued monthly by the U.S. Department of Commerce.
Existing Home Sales. These data are issued monthly by the National Association of Realtors, and capture the number of existing homes that were sold in the previous month.
High-End Home Sales. This series are sales of new homes priced at $750,000 and over. The data are released quarterly by the U.S. Department of Commerce, and are not seasonally adjusted. Thus, a valid comparison is made to the same quarter of the prior year.
Mortgage Rate. We have chosen the rate on 30-year conventional loans that is issued by the Federal Home Loan Mortgage Corporation (known popularly as Freddie Mac.) Although there are a large number of mortgage instruments available to consumers, this one is still the most commonly used.
Employees in Residential Remodeling. This indicator denotes the number of individuals employed in construction firms that do mostly residential remodeling work.
Building Materials Sales. These data, released monthly by the Department of Commerce, capture the total sales of building materials, regardless of whether consumers or contractors purchased them. However, we should caution that the data also includes sales to projects other than residential houses.
Appliance Store Sales. This driver captures the monthly sales of stores that sell mostly household appliances; the data are stated at an annual rate. We should not confuse this driver with total appliance sales, since they are sold by other types of stores such as Home Centers, for instance.
We hope that you find this dashboard useful as a general guide to the state of our industry. Please contact us if you would like to see further detail.


