

Is it a recovery, or a slowdown?
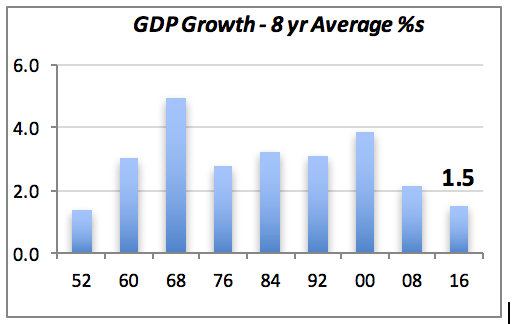
It’s almost trite to say that the US economy has had the slowest recovery in 80 years. Even though first quarter GDP was revised up to 1.4%, it still lags the average seen over the preceding eight years, pictured as the right-most bar in the chart below.
In the chart, where we display GDP growth at 8-year intervals, it’s clear that the latest 8-year period ending in 2016 shows the slowest growth at only 1.5% annual average, except for the period ending in 1952. The 8-year interval was chosen for no other reason than it’s been that many years since the recovery from the 2007-09 recession. Incidentally, of interest to those politically minded, the last three bars correspond exactly to the last three presidential terms (Clinton, Bush, Obama); except for ’68 which corresponds to the Kennedy-Johnson combined term.
Although the severe impact of the economic recession made a quick and strong recovery more difficult, economic policies followed by the Federal government and the central bank exacerbated the problem. They may have made a robust recovery nearly impossible.
Is residential construction falling temporarily?
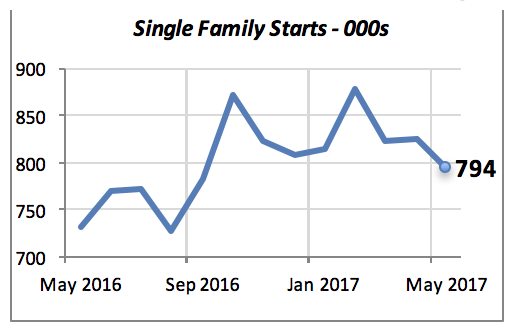
Closer to home, we saw last month’s single family housing starts fall by nearly 4% to a 794 thousand unit annual rate, although they are still 8.5% above last year’s rate. However, as can be seen in the chart below, they have declined over the last three months.
This suggests that single family starts may not reach the level we predicted late last year. We stated then that builders would start 850 thousand single family homes this year. But through May they are running at an 827 thousand unit rate. Will new housing turn around and hit 850 thousand this year?
But year-to-date housing starts are running slightly over 7% compared to last year. This is due to the sharp jump in housing starts in the middle of last year. Housing permits are also ahead of last year, by a larger margin. A total of 336 thousand single family permits have been issued through May, up 9.5% over the same period of last year.
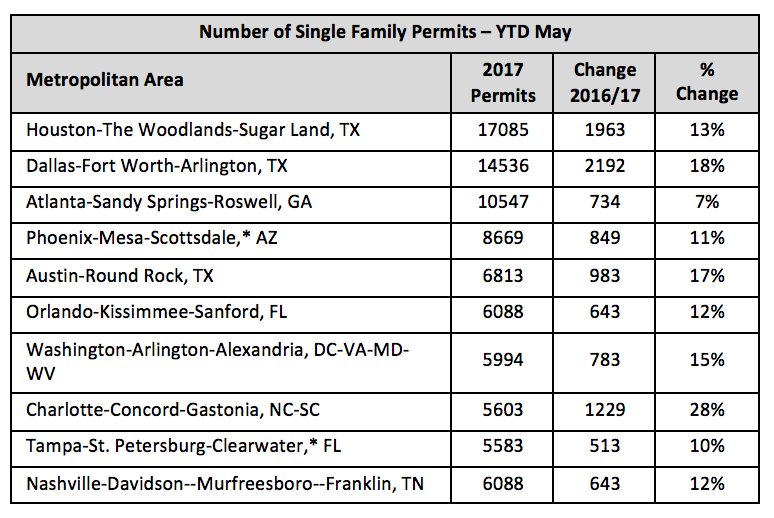
A the metro area level we find that, based on the volume of new single family construction, the ten largest metro areas are 14% ahead of last year. These metro areas, listed in the table below, account for nearly one third of all the metropolitan markets.
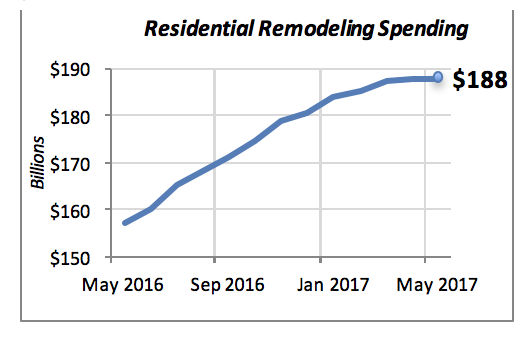
On the remodeling side, recently released data from the Dept. of Commerce indicates that residential remodeling expenditures were nearly flat in May. The data, which includes only remodeling to homeowners’ properties, indicates that homeowners spent in May at the annual rate of $187.8 billion. Further, as can be inferred visually from the chart, homeowners spent nearly 20% more than a year ago.
The chart also shows that homeowners have increased the rate of spending every month over the last year.
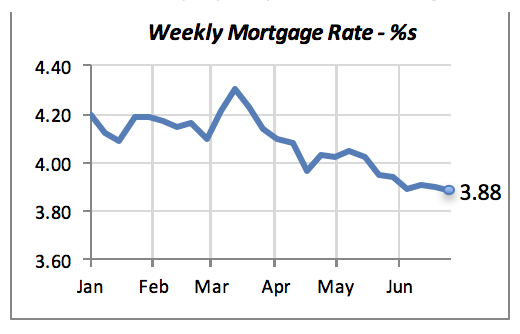
Falling Mortgage Rates
We keep highlighting mortgage rate trends in this report because they are a key factor impacting housing construction and home sales. Rates gave been falling over the last four months, even though the Fed has followed recently a policy towards raising interest rates.
Manuel Gutierrez, Consulting Economist to NKBA
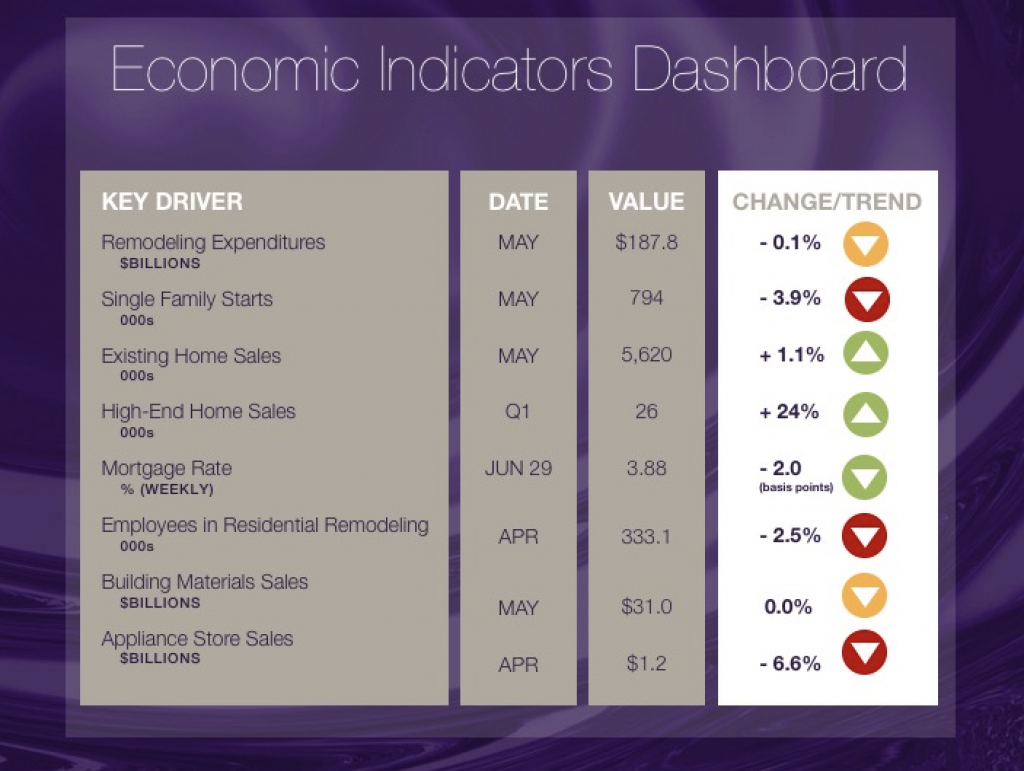
Explanation of NKBA’s Economic Indicators Dashboard
The dashboard displays the latest value of each economic indicator with a colored triangle that highlights visually the recent trend for each of the drivers. “Green” is a positive signal indicating that the latest value is improving; “Yellow,” as it’s common understood denotes caution because the variable maybe changing direction; and “Red” indicates that the variable in question is declining, both in its current value and in relation to the recent past.
Note that all the data, except for “mortgage rate” and “appliance store sales” are seasonally adjusted and are represented at annual rates.
Remodeling Expenditures. This is the amount of money spent on home improvement projects during the month in question. It covers all work done for privately-owned homes (excludes rentals, etc.). The data are in billions of dollars and are issued monthly by the U.S. Department of Commerce.
Single Family Starts. It is the number of single family houses for which construction was started in the given month. The data are in thousands of houses and are issued monthly by the U.S. Department of Commerce.
Existing Home Sales. These data are issued monthly by the National Association of Realtors, and capture the number of existing homes that were sold in the previous month.
High-End Home Sales. This series are sales of new homes priced at $750,000 and over. The data are released quarterly by the U.S. Department of Commerce, and are not seasonally adjusted. Thus a valid comparison is made to the same quarter of prior year.
Mortgage Rate. We have chosen the rate on 30-year conventional loans that is issued by the Federal Home Loan Mortgage Corporation (known popularly as Freddie Mac.) Although there are a large number of mortgage instruments available to consumers, this one is still the most commonly used.
Employees in Residential Remodeling. This indicator denotes the number of individuals employed in construction firms that do mostly residential remodeling work.
Building Materials Sales. These data, released monthly by the Department of Commerce, capture the total sales of building materials, regardless of whether consumers or contractors purchased them. However, we should caution that the data also includes sales to projects other than residential houses.
Appliance Store Sales. This driver captures the monthly sales of stores that sell mostly household appliances; the data are stated at an annual rate. We should not confuse this driver with total appliance sales, since they are sold by other types of stores such as Home Centers, for instance.
We hope that you find this dashboard useful as a general guide to the state of our industry. Please contact us if you would like to see further detail.


