


Home builders started construction of new homes in June at an annual rate that almost matches last year’s pace: 1.186 million units. This is just 4% lower than last year, and further, they were 17% above the prior month.
The chart below illustrates the strength of the new housing market in the first two months of this year. Houses were started at a pace that was 300,000 units faster than any of the prior four years, only to collapse in March when the pandemic shutdown took effect.

The chart also shows the relative stability of new housing construction from 2016 through 2019, and how housing starts began to improve in the last few months of last year.
The question of whether the last two months’ rebound will continue remains unanswered, naturally, but there are economic forces that suggest that new housing construction should stay on this path, barring another drastic economic shutdown. Mortgage rates remain very favorable (discussed in greater detail below) and the inventory of homes for sale remains extremely low, relative to demand. That gap is partly filled by home builders starting construction of new houses.
Currently, as of May, the inventory of existing homes for sale was 19% lower than a year ago. The greater demand for houses is showing up in higher prices. The price of an existing home in May was 2.3% higher than in May 2019.
Construction Spikes in Single-Family and Multifamily Units
The increases in June housing starts was brought about equally by gains in single- and multifamily housing. Both categories increased by a similar magnitude in June.
Single-family starts jumped 17.2% in June to an annual rate of 831,000 homes, although despite this gain, they’re still 3.9% lower than a year ago. Housing units in multifamily buildings rose 17.5% to an annual rate of 355,000 units; but they are also down compared to last year, by 4.1%.

The table below provides the latest housing starts data for the U.S., nationally and it its four major regions.

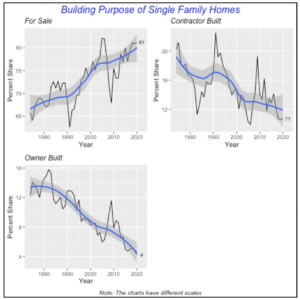
Building Purpose of New Home Construction
Home builders and general contractors begin construction of a new house, whether it’s a single-family home or units in a multifamily building, with a specific purpose in mind. Typically, they are either starting construction of a spec home with intent to sell it, or they are under contract to build the home for a specific homeowner. In a few instances, a homeowner may act as the contractor himself.
In the case of multifamily housing, builders or developers construct the buildings for either rental or to be sold as condominium units.
The vast majority of the 213,000 new single-family houses started in the first quarter were spec homes built to go up for sale, with no particular purchaser in mind. Note that this is the actual number of houses started, not seasonally adjusted or annualized. They accounted for 81% of houses started in the quarter.
Contractors built 23,000 custom houses to the specifications of homeowners who owned the lot where the houses were built. Thus, “Contractor Built” houses accounted for 11% of first-quarter activity.
Lastly, a small number of single-family houses are built by the homeowner himself acting as the contractor. There were 9,000 homes built by owners themselves, accounting for just 4% of all the houses started in the first quarter.

But single-family houses built “For Sale” have been steadily gaining in popularity over the last 50 years, as non-professionals aim to flip or build spec houses as an income-producing endeavor. The chart below shows that they accounted for about 65% of all single-family houses in the 1970s, increasing by nearly 20 percentage points to the current 81%.
Conversely, “Contractor Built” and “Owner Built” homes have been losing popularity during the same period.
Housing units in multifamily buildings are built either for rental purposes or to be sold as condominium units. Currently the vast majority of units are built “For Rent,” accounting for 94% of the units started in the first quarter of 2020.
The left pane in the chart below displays the “For Rent” units share of multifamily housing, for the first quarter of each year back to 1974. The right pane display the share of units that are “For Sale.”
Between 1974 and 2010, the share of “For Rent” units hovered around 70% to 80% of multifamily starts. The exception are two recession periods, 1980-82 and 2007-09, when that “For Rent” share fell to below 60%.
But over the last decade, the share of “For Rent” units has increased more or less steadily to reach the above-mentioned 94% in the first quarter of this year.
Conversely, the share of multifamily units built For Sale as condominiums has fallen over the last ten years to remain around six percent of the total.

Mortgage Rates Reach Historic Low
Sounding like a broken record (or whatever the equivalent digital skip-and-repeat would be), mortgage rates dropped again last week, to another all-time low of 2.98% for the 30-year, fixed rate. That’s a drop of five basis points from the previous week, and the lowest in a half-century.

Lower rates should encourage additional housing construction, home sales as well as remodeling activity. Since the initial shock of the pandemic shutdown, housing activity has recovered. New home sales in May increased by 17%, although sales of existing homes actually fell by 10% in the month; the latter is attributable mostly to a low inventory of homes for sale.
Finally, remodeling expenditures by homeowners have remained relatively stable in May, barely rising by 0.1% to $196.8 billion.

Manuel Gutierrez, Consulting Economist to NKBA
Explanation of NKBA’s Economic Indicators Dashboard
The dashboard displays the latest value of each economic indicator with a colored triangle that highlights visually the recent trend for each of the drivers. “Green” is a positive signal, indicating that the latest value is improving; “Yellow,” as it’s commonly understood, denotes caution because the variable may be changing direction; “Red” indicates that the variable in question is declining, both in its current value and in relation to the recent past.
Note that all the data, except for “mortgage rate” and “appliance-store sales” are seasonally adjusted and are represented at annual rates.
Remodeling Expenditures. This is the amount of money spent on home improvement projects during the month in question. It covers all work done for privately owned homes (excludes rentals, etc.). The data are in billions of dollars and are issued monthly by the U.S. Department of Commerce.
Single-Family Starts. This is the number of single-family houses for which construction was started in the given month. The data are in thousands of houses and are issued monthly by the U.S. Department of Commerce.
Existing-Home Sales. These data are issued monthly by the National Association of Realtors and capture the number of existing homes that were sold in the previous month.
High-End Home Sales. This series are sales of new homes priced at $500,000 and higher. The data are released quarterly by the U.S. Department of Commerce and are not seasonally adjusted. Thus, a valid comparison is made to the same quarter of prior year.
Mortgage Rate. We have chosen the rate on 30-year conventional loans that is issued by the Federal Home Loan Mortgage Corporation (known popularly as Freddie Mac.) Although there are a large number of mortgage instruments available to consumers, this one is still the most commonly used.
Employees in Residential Remodeling. This indicator denotes the number of individuals employed in construction firms that do mostly residential remodeling work.
Building-Materials Sales. These data, released monthly by the Department of Commerce, capture total sales of building materials, regardless of whether consumers or contractors purchased them. However, we should caution that the data also includes sales to projects other than residential houses.
Appliance-Store Sales. This driver captures the monthly sales of stores that sell mostly household appliances; the data are stated at an annual rate. We should not confuse this driver with total appliance sales, since they are sold by other types of stores such as home centers.
We hope you find this dashboard useful as a general guide to the state of our industry. Please contact us at Feedback@nkba.org if you would like to see further detail.


