

Employment in Free Fall
This month, unfortunately, there is no news about new jobs in the employment report since job losses dominated across all industries in the private sector. March brought the news of 701,000 jobs lost in the month, which is a sad contrast to the average of nearly 200,000 jobs gained in each of the preceding 12 months.
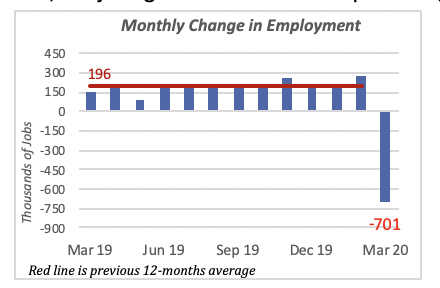
Furthermore, the large drop in March employment data does not reflect accurately the reduction in employment for the month. This is because the data is collected around the middle of the month, and typically captures the situation for the first two weeks of the month. But, as has been well documented, national employment really took a big hit in the last two weeks of March, when most of the country went into a virtual shutdown. And things will get worse this month.
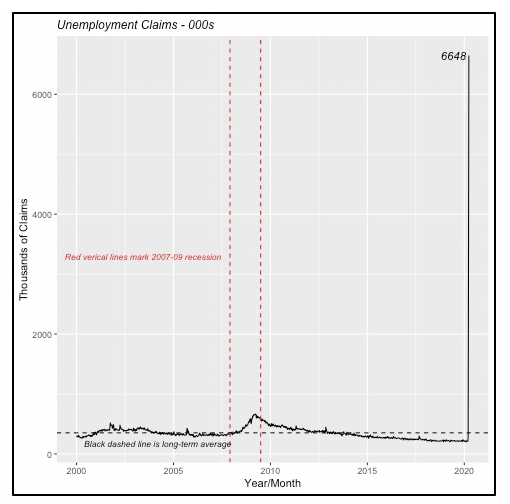
The current situation is interpreted better by the number of new Unemployment Claims filed — more than 6.6 million individuals filed claims last week alone. This is twice the 3.3 million filed the previous week. This means that the job losses in March should be closer to 10 million, rather than the official figure of 701,000.
By comparison, 8.7 million jobs were lost in the Great Recession between mid-2008 and mid-2010. The U.S. has now lost most jobs in a month than the gradual shedding of jobs over that two-year period a decade ago.
The unemployment rate increased by almost one percentage point, moving to 4.4% in March from 3.5% the previous month. And the participation rate fell to 62.7%, the lowest since mid-2018. The participation rate is the sum of persons employed and those unemployed who are actively looking for a job.
Further, the dismal economic situation resulted in more than 1.6 million people quitting the labor force. These are people who were either employed and lost their job, or unemployed, who gave up on seeking employment altogether. Over the last three years, the labor force has increased by an average of 130,000 each month; that is an increase of more than 1.5 million people annually joining the U.S. labor market.
Nearly two-thirds (64%) of last month’s employment loss were in the Hospitality sector, i.e. hotels, resorts, amusement parks, etc. Employment in this sector fell by 446,000 in March, as these businesses were the ones hit first by the reaction to the pandemic.
Virtually all industries and businesses in the private sector saw a reduction in employment. However, there was an increase in government employment, mainly at the Federal level, where hiring related to this year’s Census boosted the figures.
Manufacturer Shipments of Durables Rise
The only good news is really old news, that is, economic data prior to the time that the pandemic crisis hit the nation.
Last week reported that shipments of manufacturer Durable Goods increased in February by almost 1% to $252 billion, and orders were up by 1.2% to $249 billion for the month.
However, when the just-released Non-Durable Goods data is included, we find that total shipments fell by 0.2% for the month to $500 billion. Orders, in the other hand, were flat at $497 billion compared to January’s level.
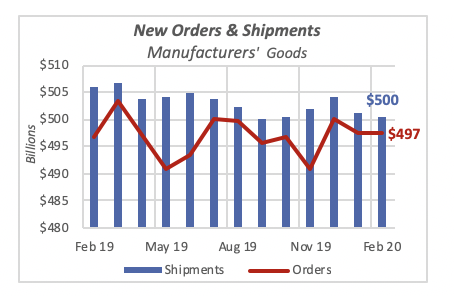
But most of the decline in the value of manufacturers’ shipments of non-durable goods was a sizable reduction in Petroleum products which, as is well known, is driven by the price of oil in the world market. Petroleum products’ value fell by 3.9% for the month.
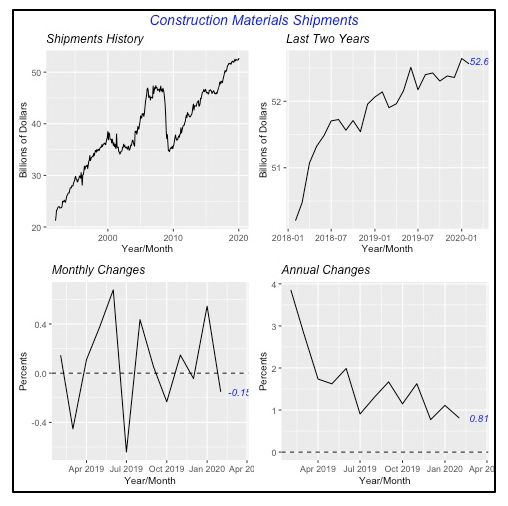
Closer to our industry, shipments of Construction Materials & Supplies were virtually unchanged in the month, falling by 0.15% to $52.56 billion. They account for 11% of the total value of manufacturer shipments.
But even without the turmoil caused by Coronavirus, the pace of change compared to the prior year had been decelerating over the last few months. As the bottom right graph in the chart below shows, shipments had been roughly 1% lower compared to the same months in 2019.
Construction Spending Drops
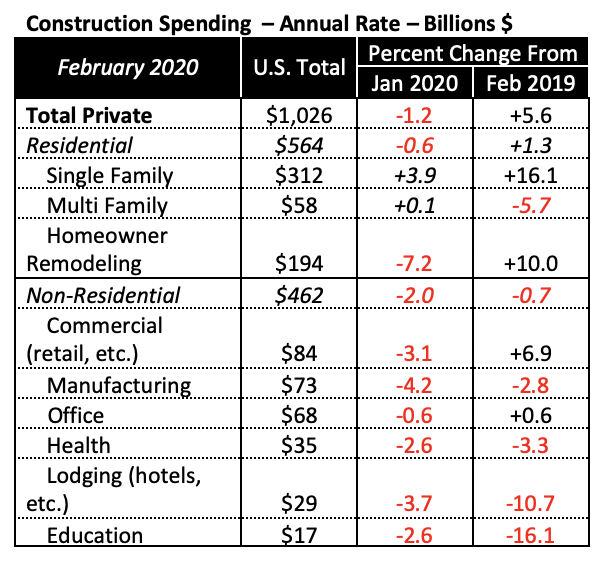
Perhaps in a signal of what was to come, spending for private construction projects fell 1.2% in February to an annualized rate of $1.03 trillion. This is the first time in eight months that construction spending turned downward. The value of construction done in the month fell for the vast majority of building types, but more critically in residential remodeling.
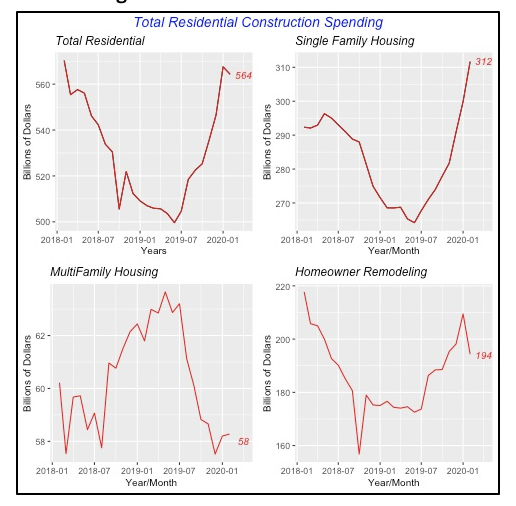
While spending for New Housing projects rose further in the month, both for single-family as well as multifamily houses, spending by homeowners for remodeling their homes actually fell by 7.25% to an annualized rate of $194 billion. The table below shows data on spending for selected building types.
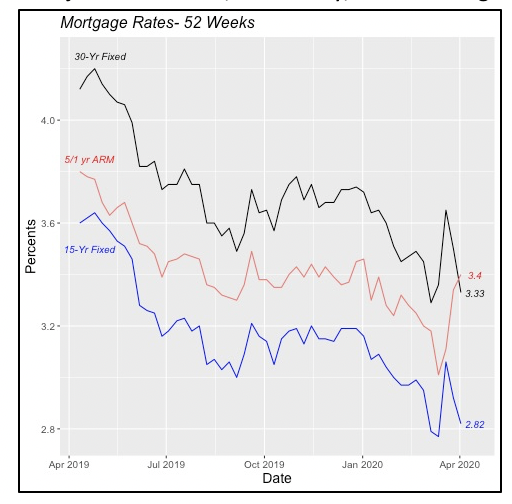
Mortgage Rates Continue Their Slide
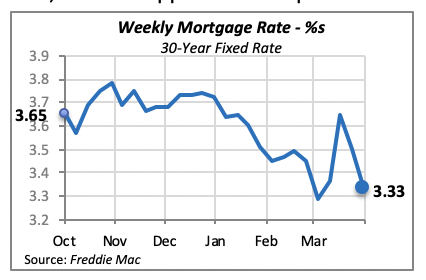
The virtual collapse of the U.S. economy, combined with the efforts by the Federal Reserve Bank to add liquidity to the system, has driven interest rates still further down. The Federal Funds rate, the one over which the central bank has greatest influence, is hovering under 0.25%, down from 1.5% range just two weeks ago.
Most other rates have fallen, too, including mortgage rates such as the 30-year fixed rate, which dropped 15 basis point to 3.33% last week.
Curiously, while fixed rates fell, those for adjustable rate mortgages (ARMs) have actually risen the last couple of weeks as illustrated by the red line in the chart below. This could either reflect a move by borrowers toward ARMs, driving demand for funds at adjustable rates or, more likely, fewer funds going into those types of mortgages.
Manuel Gutierrez, Consulting Economist to NKBA
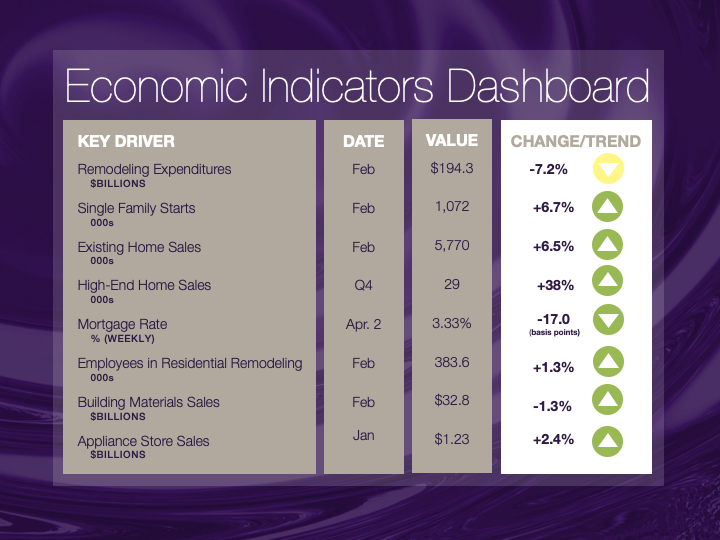
Explanation of NKBA’s Economic Indicators Dashboard
The dashboard displays the latest value of each economic indicator with a colored triangle that highlights visually the recent trend for each of the drivers. “Green” is a positive signal, indicating that the latest value is improving; “Yellow,” as it’s commonly understood, denotes caution because the variable may be changing direction; “Red” indicates that the variable in question is declining, both in its current value and in relation to the recent past.
Note that all the data, except for “mortgage rate” and “appliance-store sales” are seasonally adjusted and are represented at annual rates.
Remodeling Expenditures. This is the amount of money spent on home improvement projects during the month in question. It covers all work done for privately owned homes (excludes rentals, etc.). The data are in billions of dollars and are issued monthly by the U.S. Department of Commerce.
Single-Family Starts. This is the number of single-family houses for which construction was started in the given month. The data are in thousands of houses and are issued monthly by the U.S. Department of Commerce.
Existing-Home Sales. These data are issued monthly by the National Association of Realtors and capture the number of existing homes that were sold in the previous month.
High-End Home Sales. This series are sales of new homes priced at $500,000 and higher. The data are released quarterly by the U.S. Department of Commerce and are not seasonally adjusted. Thus, a valid comparison is made to the same quarter of prior year.
Mortgage Rate. We have chosen the rate on 30-year conventional loans that is issued by the Federal Home Loan Mortgage Corporation (known popularly as Freddie Mac.) Although there are a large number of mortgage instruments available to consumers, this one is still the most commonly used.
Employees in Residential Remodeling. This indicator denotes the number of individuals employed in construction firms that do mostly residential remodeling work.
Building-Materials Sales. These data, released monthly by the Department of Commerce, capture total sales of building materials, regardless of whether consumers or contractors purchased them. However, we should caution that the data also includes sales to projects other than residential houses.
Appliance-Store Sales. This driver captures the monthly sales of stores that sell mostly household appliances; the data are stated at an annual rate. We should not confuse this driver with total appliance sales, since they are sold by other types of stores such as home centers.
We hope you find this dashboard useful as a general guide to the state of our industry. Please contact us at Feedback@nkba.org if you would like to see further detail.


