

Employment Still Booming
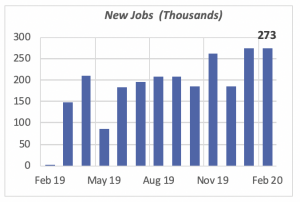
Despite the trade disputes over the last couple of years, and the threat to the economy from Coronavirus, which has the stock markets and the whole world in turmoil, employers added 273,000 jobs in February. This is the largest number of new jobs in over a year; in fact, it’s the highest since May 2018, when 278,000 jobs were added.
Further, the Bureau of Labor Statistics revised the employment January data upward by nearly 50,000. The chart below shows that employment growth has exceeded 250,000 workers in three of the last four months.
As we all know, the Coronavirus epidemic began sometime in December in China. The employment figures thus reflect two months of negative health news, even though there were few cases confirmed in the U.S. prior to the second week of February. This is important to acknowledge because employment data is collected around the second week of each month. In other words, the statistics do not reflect any impact from the recent announcements on Coronavirus infections and deaths in the U.S.
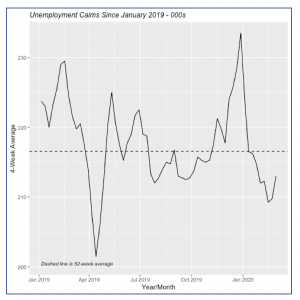
However, given the cautionary reaction of many businesses to reduce meetings and travel, for instance, observers expect that job growth will slow in the coming months. There might even be an increase in layoffs, as some businesses are forced to reduce their workforces. Airlines, for example, have been reducing the number of flights they are operating as travel dwindles. Of course, it is still too soon to see an uptick in unemployment claims by laid-off workers, but last week, claims rose modestly to 213,000, a number below the 218,000 average seen over the latest 52 weeks.
Other employment statistics were also favorable in February. The unemployment rate fell by 0.1% to 3.5%; it has hovered between 3.5% and 3.6% over the past six months. Both the labor participation rate and growth in hourly wages remained unchanged from their values in the previous month.
The labor participation rate was at 63.4% in February, the same level as in the previous month. However, the rate is an improvement over its level a year ago, in February 2019, when it was 63.1%. Wage growth has remined at 3.3% over the last year.
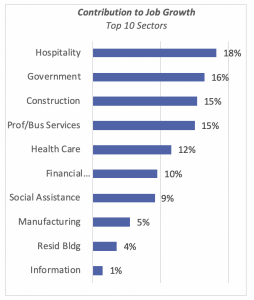
The biggest contributor to last month’s job increase was the Hospitality & Leisure sector which accounted for nearly one in five of February’s new jobs. This is followed by Government, which added 16% of the total, and Constructionand Professional & Business Services, each adding 15% of the total.
(Note: Figures don’t equal 100% because some sectors not represented here recorded job losses, which would balance the tally to 100%.)
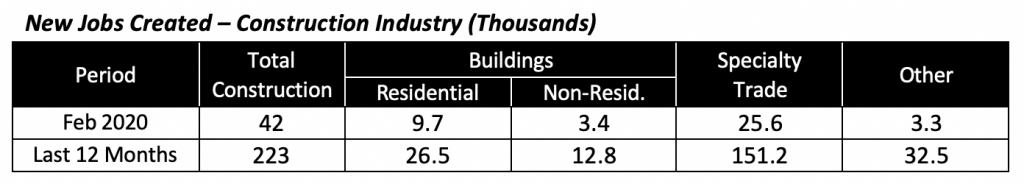
Employment in Construction businesses overall added 42,000 jobs last month, and it has added 223,000 in the latest 12-month period. Within construction itself, the largest addition was among the Construction Specialty Trades, which added 25,600 jobs in the month.
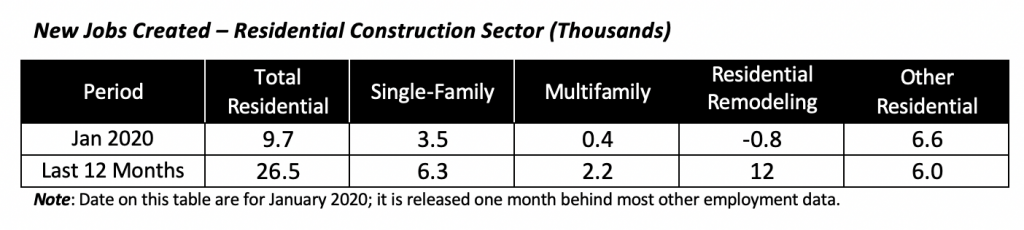
Employment in residential construction was up overall, but one of its three components, Residential Remodelingfirms, employment actually fell in January (the latest month for which detail residential construction employment is available.)
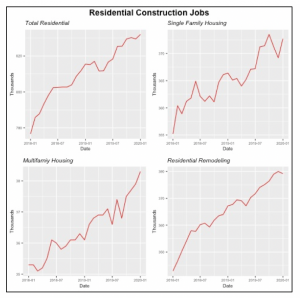
Within the Residential Construction sector, the number of employees in New Residential projects, both for single- and multifamily homes, has risen since the start of the year. But employment in firms involved in Residential Remodeling actually dipped in January (see chart below).
Residential Construction Spending Rises
A slightly different view of the health of the construction industry is through the lens of the amount spent by businesses and consumers in the industry.
This year started on a strong note, with total residential construction spending up 2.1% in January, to reach an annual pace of $555 billion. Residential construction has been rising continuously for the last seven months, from the low point of just under $500 billion seen in June 2019.
On an annual basis, total residential construction in January was 9% above its year-ago level.
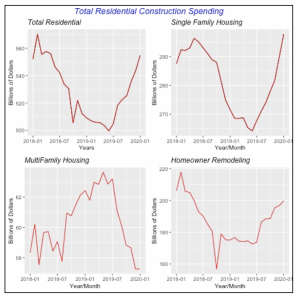
The strength in total residential construction is driven primarily by strong gains in spending for single-family housing, which rose 2.8% in January to reach an annual rate of $298 billion, and is supported by a 1.5% rise in homeowner remodeling.
However, spending for construction of multifamily housing units was unchanged in January at just $57 billion (annualized). Also, in contrast to construction of single-family houses, spending for multifamily units has been declining since last June, when spending was running at an annualized pace of $63 billion.
One reason for the declining rate of spending in multifamily housing is the move toward building units for rent, rather than condominiums, which usually carry a higher price tag.
Homeowners’ Remodeling Spending Is Strong
Homeowners’ spending for remodeling their homes continues to increase, rising by another 1.5% in January, to reach an annual rate of just under $200 billion. January marks the seventh consecutive month of increases in remodeling, as homeowners continue to invest and improve their homes.
Despite these increases, remodeling still trails the pace seen in early 2018, when homeowners were spending at a rate near $210 billion annually.
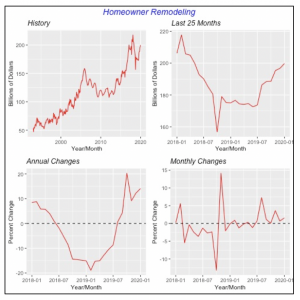
But compared to early 2019, however, remodeling is running a very strong 14% higher. Following a dip in the first half of last year, homeowner spending regained strength and began its current course of continuous, steady gains.
The combination of low mortgage rates and home price appreciation is enabling many homeowners to take cash out of the increased equity value of their homes. Some of those funds are used for remodeling projects.
Manufacturing Orders and Shipments Fall
Manufacturing orders and shipments fell in January, although both are roughly at the same level as the last six months’ average. Further, both fell by the same percentage (0.5%) compared to the previous month.
There has been a steady deterioration in both manufacturing orders and shipments since the end of 2018, when the administration’s changes in trade policies began to take effect. Orders and shipments reached peaks in the second quarter of that year, but have fallen since.
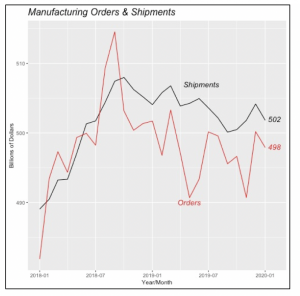
Orders are 0.8% lower than they were in January 2019, and shipments were also lower, by 0.5%.
Note in the chart above that orders have been lower than shipments over the last year-and-a-half. This simply reflects the fact that manufacturers are shipping product out of their existing stock, thereby drawing down their inventories. This does not portend good news for the near future.
Despite last January’s decline in total shipments, many product categories still show shipment increases, although two of the most important groups, Transportation and Petroleum products, had fewer shipments in January than the previous month.

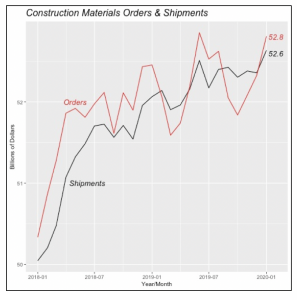
Construction Materials and Supplies is one of bright spots in the manufacturing sector. The improving health of new home construction is naturally having a direct impact on the demand for construction materials.
Both orders and shipments increased in January. Orders for construction materials jumped by 0.9% to $52.8 billion, and shipments by half a percentage point to $52.6 billion. Their rising trend can be clearly seen in the chart below.
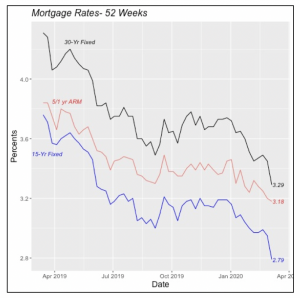
Mortgage Rates See Largest Drop Since June
In a perhaps panic move, Federal Reserve Chair Jerome Powell abruptly called a meeting last week to review the economic situation in light of the Coronavarius (COVID-19) health scare. At this meeting, the Fed Committee decided to lower the federal funds rate by 0.5% to a range between 1.00% and 1.25%.
This policy move had the effect of lowering interest rates for most loan types, including mortgages. Thus the 30-year, fixed mortgage rate, as well as the 15-year equivalent, were down 16 basis points each last week. The 30-year fixed fell to 3.29% and the 15-year fixed rate came down to 2.79%.
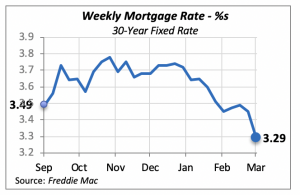
Adjustable rate mortgage rates also dropped last week, but by a smaller 0.02% to 3.18%.
Manuel Gutierrez, Consulting Economist to NKBA
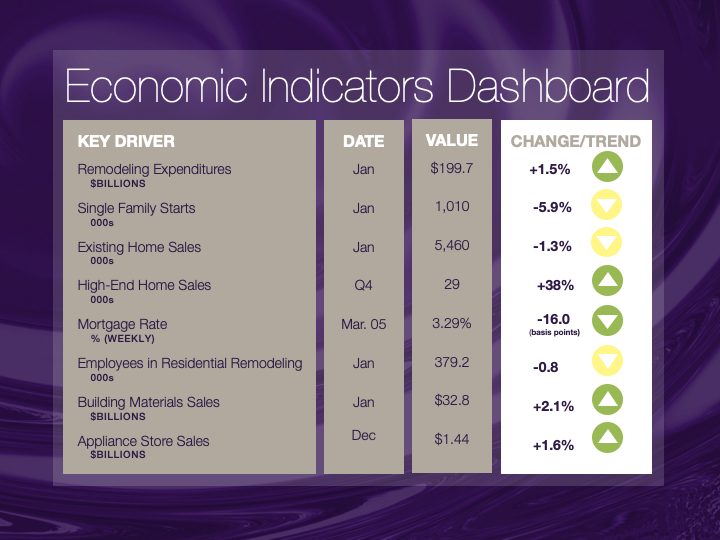
Explanation of NKBA’s Economic Indicators Dashboard
The dashboard displays the latest value of each economic indicator with a colored triangle that highlights visually the recent trend for each of the drivers. “Green” is a positive signal, indicating that the latest value is improving; “Yellow,” as it’s commonly understood, denotes caution because the variable may be changing direction; “Red” indicates that the variable in question is declining, both in its current value and in relation to the recent past.
Note that all the data, except for “mortgage rate” and “appliance-store sales” are seasonally adjusted and are represented at annual rates.
Remodeling Expenditures. This is the amount of money spent on home improvement projects during the month in question. It covers all work done for privately owned homes (excludes rentals, etc.). The data are in billions of dollars and are issued monthly by the U.S. Department of Commerce.
Single-Family Starts. This is the number of single-family houses for which construction was started in the given month. The data are in thousands of houses and are issued monthly by the U.S. Department of Commerce.
Existing-Home Sales. These data are issued monthly by the National Association of Realtors and capture the number of existing homes that were sold in the previous month.
High-End Home Sales. This series are sales of new homes priced at $500,000 and higher. The data are released quarterly by the U.S. Department of Commerce and are not seasonally adjusted. Thus, a valid comparison is made to the same quarter of prior year.
Mortgage Rate. We have chosen the rate on 30-year conventional loans that is issued by the Federal Home Loan Mortgage Corporation (known popularly as Freddie Mac.) Although there are a large number of mortgage instruments available to consumers, this one is still the most commonly used.
Employees in Residential Remodeling. This indicator denotes the number of individuals employed in construction firms that do mostly residential remodeling work.
Building-Materials Sales. These data, released monthly by the Department of Commerce, capture total sales of building materials, regardless of whether consumers or contractors purchased them. However, we should caution that the data also includes sales to projects other than residential houses.
Appliance-Store Sales. This driver captures the monthly sales of stores that sell mostly household appliances; the data are stated at an annual rate. We should not confuse this driver with total appliance sales, since they are sold by other types of stores such as home centers.
We hope you find this dashboard useful as a general guide to the state of our industry. Please contact us at Feedback@nkba.org if you would like to see further detail.


