

New Home Sales Dip
In contrast to sales of existing homes data, which rose 3.6% in December, sales of new homes moved in the opposite direction, falling 0.4% to an annual rate of 694,000, marking the third consecutive month of sales declines in the category.
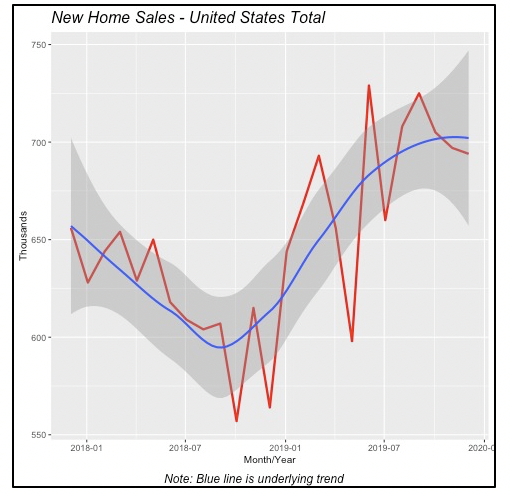
Even with the decline, new-home sales in December were still a strong 23% above the year before, when they were running at a rate of 564,000. Moreover, the momentum of the first nine months of last year was sufficiently strong enough to cap the year with the most home sales since 2007, right at the start of the Great Recession of 2007-09.
South Leads in Regional Sales
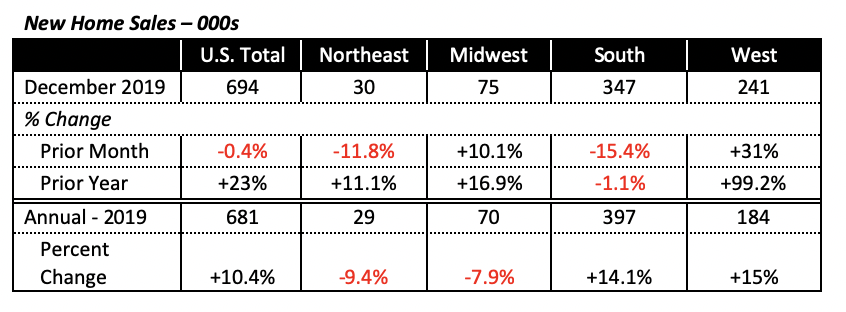
Two of the four regions posted declines in December, with the most important regions, the South, posting the largest decline. Further, sales in the South were also lower than those of December 2018, unlike the other three regions where new home sales were higher than the prior year’s December.
Despite December’s declines, home sales for the year ended stronger in the South and the West, bringing their contribution up to 85% of U.S. new-home sales. But the South region is the one boosting national home sales; this region represented just 40% of all new home sales in the late 1980s, increasing steadily to reach 58% of the total last year. That is, currently, nearly six in 10 American new-home sales take place in the South.
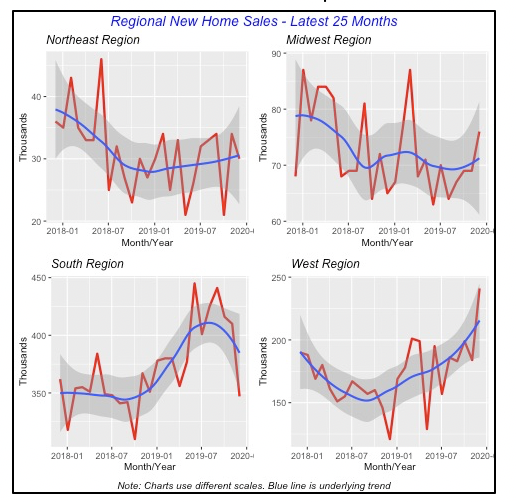
The South’s strength in new home sales makes sense in light of the sharp population gains the region has seen over the last few decades. Texas and Florida alone account for one-third the U.S. population growth that occurred between 2010 and 2018.
Sales of High-End Homes Spike
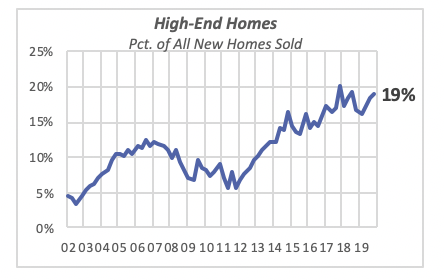
New high-end homes, that is homes selling for $500,000 or more, saw a 38% jump in the fourth quarter of 2019 from the prior year, to reach 29,000 in sales.
For the last four years, high-end homes have ranged between 15% and 20% of all new homes sold. This is significantly higher than the “housing boom” years of 2002-2008, when they ranged between 5% and 12%.
In the fourth quarter, 19% of new homes sold were priced at $500,000 or more.
Housing Prices Somewhat Stable
The price of new houses sold naturally does not reflect the price of all homes, since new homes represent only a fraction of all houses sold in a given year. In fact, last year, new homes accounted for just 11% of all houses sold. Also, even though house prices change from month to month, and year to year, they do not reflect the real value of houses. This is because reported home prices might reflect houses sold in different locations, larger or smaller homes than previously, or houses with more amenities.
For instance, a drop in the price of homes sold in a month could mean that houses sold in that month were smaller, or in regions or areas in the country where houses may be priced below average. Similarly, if the houses sold in a year are bigger than those of the prior year, it does not mean that the intrinsic value of the houses has increased, but rather, that the value may mean that consumers are purchasing larger, more expensive homes or those with more amenities.
To capture the real change in house prices, economists Chip Case and Robert Shiller developed an index comparing the change in the price of homes that have been sold at least twice over time. Those price changes are then aggregated across all homes with multiple sales to come up with an index that reflects the average price for each month. (Of course, this is a simplified explanation but hopefully captures the gist of the method.) This is known as the Case-Shiller house price index.
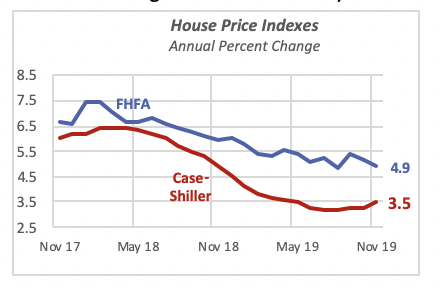
The chart below displays the annual percent changes in the two most common price indexes, the Case-Shiller issued by Corelogic (typically the more popular measure), and the Federal Housing Finance Agency (FHFA). Both show the rate of price increases falling over the last two years, except that the FHFA price index increases are higher.
Also, the Case-Shiller index suggests that home prices stabilized, and began rising faster over the last couple of months. The FHFA index, on the other hand, pretty much has lower price increases through November of last year — the latest month for which data are available.
GDP Growth Softens
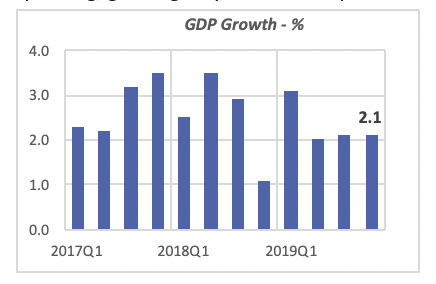
Fourth-quarter GDP growth came in as expected, at 2.1%,which is lower than the 2.7% pace seen in the previous two years. The low GDP growth was a result of very modest consumer spending, growing only 1.8% in the quarter compared to 2.8% over the previous three years.
Also, more importantly, business investment fell by 1.5% in the fourth quarter, following declines in the previous two quarters. It is very unusual to see investment spending decline for several consecutive quarters in an expanding economy, like the current one.
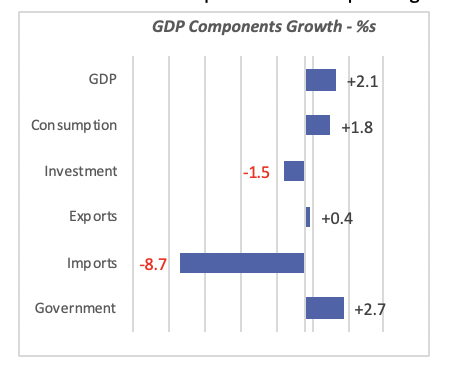
The decline in imports captures the impact of the trade situation, especially with China. Imports are expected to fall further in the next few months until — or unless — the Coronavirus is controlled, and trade restrictions are removed.
Mortgage Rates Drop Again
Last week the 30-year, fixed mortgage rate fell further, by 0.09% to 3.51%, the lowest rate since early September.
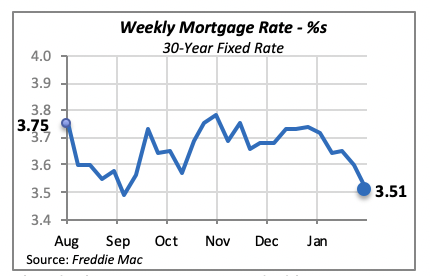
This decline may give a needed boost to consumers willing to either jump in to purchase a home or remodel their existing house, since many consumers take advantage of relatively low mortgage rates to extract cash from their home equity or refinance their homes.
Manuel Gutierrez, Consulting Economist to NKBA
Explanation of NKBA’s Economic Indicators Dashboard
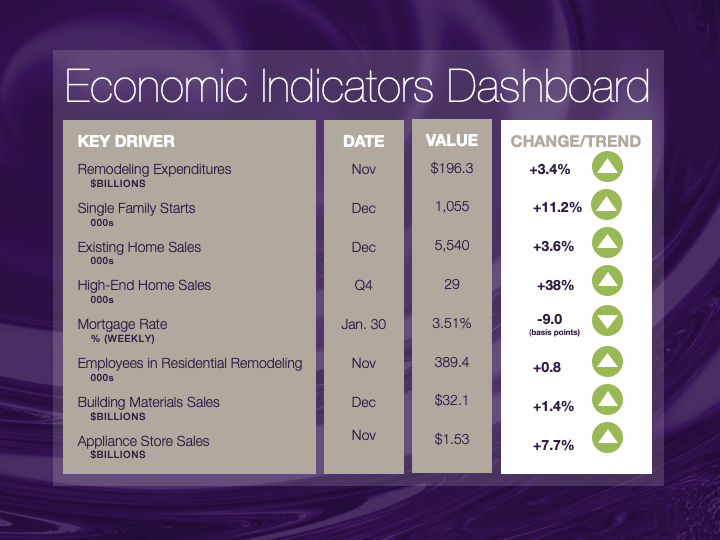
The dashboard displays the latest value of each economic indicator with a colored triangle that highlights visually the recent trend for each of the drivers. “Green” is a positive signal, indicating that the latest value is improving; “Yellow,” as it’s commonly understood, denotes caution because the variable may be changing direction; “Red” indicates that the variable in question is declining, both in its current value and in relation to the recent past.
Note that all the data, except for “mortgage rate” and “appliance-store sales” are seasonally adjusted and are represented at annual rates.
Remodeling Expenditures. This is the amount of money spent on home improvement projects during the month in question. It covers all work done for privately owned homes (excludes rentals, etc.). The data are in billions of dollars and are issued monthly by the U.S. Department of Commerce.
Single-Family Starts. This is the number of single-family houses for which construction was started in the given month. The data are in thousands of houses and are issued monthly by the U.S. Department of Commerce.
Existing-Home Sales. These data are issued monthly by the National Association of Realtors and capture the number of existing homes that were sold in the previous month.
High-End Home Sales. This series are sales of new homes priced at $500,000 and higher. The data are released quarterly by the U.S. Department of Commerce and are not seasonally adjusted. Thus, a valid comparison is made to the same quarter of prior year.
Mortgage Rate. We have chosen the rate on 30-year conventional loans that is issued by the Federal Home Loan Mortgage Corporation (known popularly as Freddie Mac.) Although there are a large number of mortgage instruments available to consumers, this one is still the most commonly used.
Employees in Residential Remodeling. This indicator denotes the number of individuals employed in construction firms that do mostly residential remodeling work.
Building-Materials Sales. These data, released monthly by the Department of Commerce, capture total sales of building materials, regardless of whether consumers or contractors purchased them. However, we should caution that the data also includes sales to projects other than residential houses.
Appliance-Store Sales. This driver captures the monthly sales of stores that sell mostly household appliances; the data are stated at an annual rate. We should not confuse this driver with total appliance sales, since they are sold by other types of stores such as home centers.
We hope you find this dashboard useful as a general guide to the state of our industry. Please contact us at Feedback@nkba.org if you would like to see further detail.


