

New Residential Construction Bubbles Up
Total housing starts jumped favorably by 3% to an annualized rate of 1.37 million units in November, for the second-highest rate of construction activity in more than a decade. Housing starts exceeded an annualized rate of 1.3 million units in three of the last four months, when they averaged 100,000 more units than the previous seven months’ monthly average.
Both single- and multifamily starts contributed to this gain. Single-family starts rose by 2.4% on the month to reach an annual rate of 938,000 units, while multifamily starts doubled that at 4.9%, for a pace of 427,000 units.
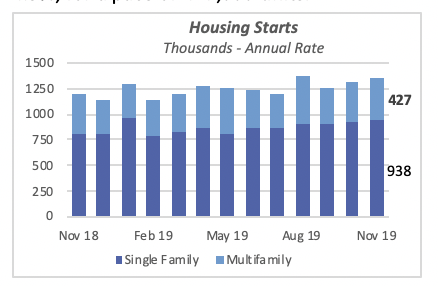
Compared to a year ago, total starts are up just under 14%, with single-family starts up an even higher 17%, and multifamily starts 7% above their level in November 2018.
Despite the last few months’ gains, housing starts year-to-date through November are barely above last year’s levels. Only 6,600, or 0.6%, more housing units have been started so far this year compared to the same period in 2018. Were it not for more than 10,000 multifamily units built this year, total construction would be down, since fewer single-family houses have been started year-to-date this year than in 2018.
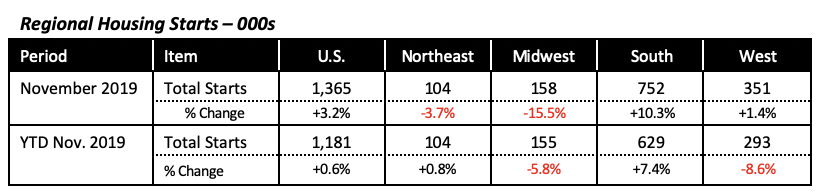
Regionally, as previously reported, the strength of national new housing construction lies on the South’s shoulders. For both the month of November, as well as year-to-date, the South exceeds prior-period levels. In fact, more than 43,000 homes have been started in the South so far this year than in 2018; this is seven times the number of houses added nationally. The Midwest and the West are both down compared to last year, while the Northeast is building the same number of houses as last year.
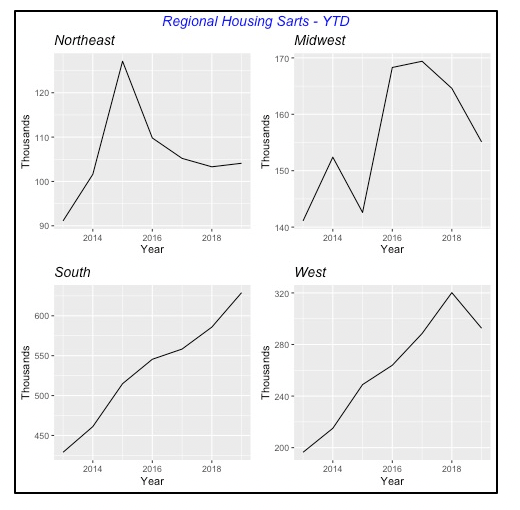
The South’s influence on national housing construction can be appreciated in the chart below, which that shows year-to-date, more houses have been started in that region every year since 2012. This more than compensates for housing construction in the other three regions, where it has either stalled over the last few years, as in the Northeast, or actually fallen, as in the Midwest and the West.
Five Jobs Are Available for Every Four Unemployed Workers
It is well known that, despite the trade disputes that have lowered foreign demand for many American products, businesses still face a large number of unfilled jobs. This is a situation that has been rarely faced historically in the U.S. on a national level, except for lack of fit workers in certain industries or sections of the country. Currently, there are 1.46 million more jobs available than there are unemployed workers. Although it’s lower than last year’s 1.58 million, the figure is remarkably high and a boon to workers.
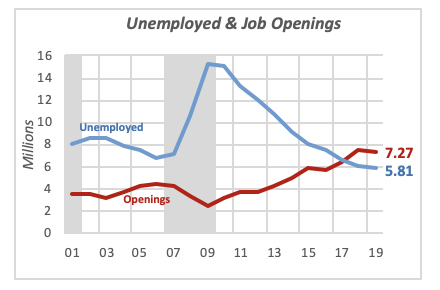
Even though there is no reliable data on job openings prior to 2000, anecdotal evidence suggests that the U.S. economy had typically more unemployed people than jobs available. This is particularly true in recessions, such as the 2007-2009 recession, highlighted in gray in the chart above, where the number of unemployed far exceeded the number of open jobs.
There are two factors that are more critical in driving the current situation. One is the strong economy, which went from roughly 2% annual growth since the turn of the century, to over 2.5% over the last three years. Strong growth naturally leads to greater demand for workers.
The second factor is the aging U.S. population and, more specifically, the great number of individuals who are reaching retirement age and thus moving out of the labor force.
Even though the number of job openings has declined throughout most of this year, the number is still much higher than the previous data, which goes back to just the beginning of this century.
The expansion of employment has led to job openings across all industries, although it is more predominant in some, as shown in the chart below, which shows highlights of the four sectors with highest growth. The gray lines represent the other industries or sectors for which such data are collected.
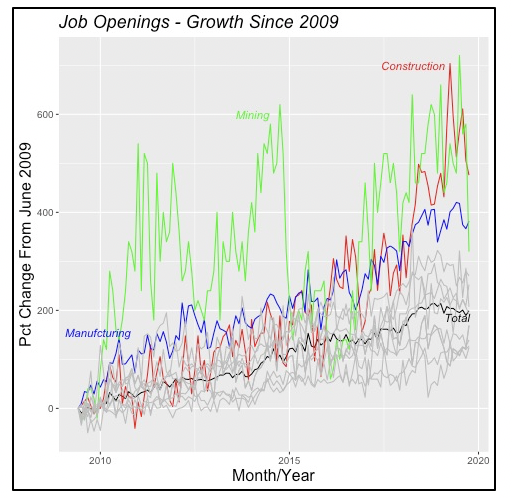
Leading with highest percentage growth in the number of jobs openings are Mining and Construction, each of which has seen the number of opening rise by 500% to 600%. The third highest in importance is Manufacturing, where the number of openings has risen by 400% since the bottom of the recession in June 2009.
Mortgage Rates Remain Stable
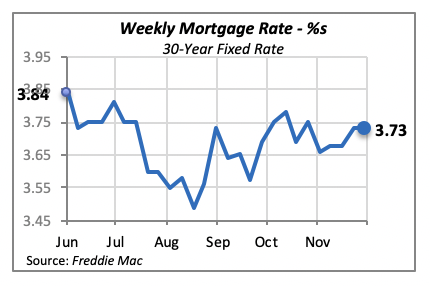
With no action emanating from the Federal Reserve Bank, mortgage rates are not likely to move much unless consumer demand for funds surges. Last week, there was no change in the 30-year, fixed mortgage rate, which remained at 3.73%. It is very unlikely that rates will rise in the near future, since typically both housing sales and remodeling demand drop in December. In fact, housing starts in December are normally 20% below the average of the previous 11 months. Similarly, remodeling spending is approximately 15% lower in December than the January-through-November average. This is precisely one of the reasons why the data on housing, remodeling and other economic variables are normally adjusted for seasonality, that is, adjusted to remove from the data any repetitive, predictable monthly fluctuations.
Manuel Gutierrez, Consulting Economist to NKBA
Explanation of NKBA’s Economic Indicators Dashboard
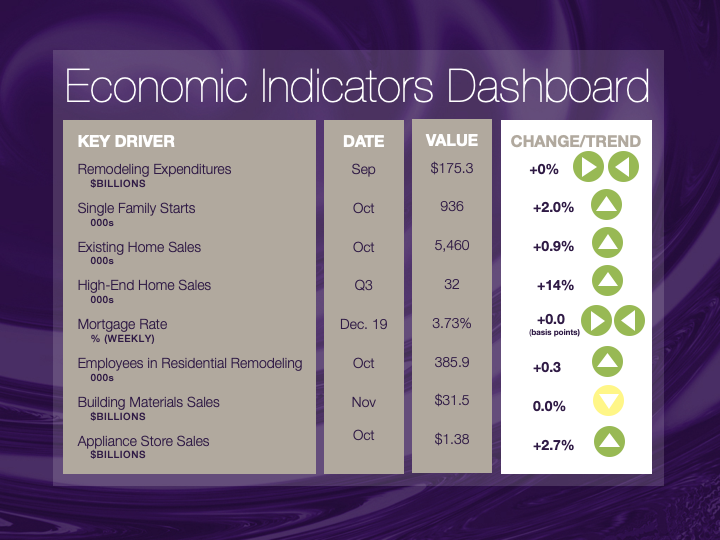
The dashboard displays the latest value of each economic indicator with a colored triangle that highlights visually the recent trend for each of the drivers. “Green” is a positive signal, indicating that the latest value is improving; “Yellow,” as it’s commonly understood, denotes caution because the variable may be changing direction; “Red” indicates that the variable in question is declining, both in its current value and in relation to the recent past.
Note that all the data, except for “mortgage rate” and “appliance-store sales” are seasonally adjusted and are represented at annual rates.
Remodeling Expenditures. This is the amount of money spent on home improvement projects during the month in question. It covers all work done for privately owned homes (excludes rentals, etc.). The data are in billions of dollars and are issued monthly by the U.S. Department of Commerce.
Single-Family Starts. This is the number of single-family houses for which construction was started in the given month. The data are in thousands of houses and are issued monthly by the U.S. Department of Commerce.
Existing-Home Sales. These data are issued monthly by the National Association of Realtors and capture the number of existing homes that were sold in the previous month.
High-End Home Sales. This series are sales of new homes priced at $500,000 and higher. The data are released quarterly by the U.S. Department of Commerce and are not seasonally adjusted. Thus, a valid comparison is made to the same quarter of prior year.
Mortgage Rate. We have chosen the rate on 30-year conventional loans that is issued by the Federal Home Loan Mortgage Corporation (known popularly as Freddie Mac.) Although there are a large number of mortgage instruments available to consumers, this one is still the most commonly used.
Employees in Residential Remodeling. This indicator denotes the number of individuals employed in construction firms that do mostly residential remodeling work.
Building-Materials Sales. These data, released monthly by the Department of Commerce, capture total sales of building materials, regardless of whether consumers or contractors purchased them. However, we should caution that the data also includes sales to projects other than residential houses.
Appliance-Store Sales. This driver captures the monthly sales of stores that sell mostly household appliances; the data are stated at an annual rate. We should not confuse this driver with total appliance sales, since they are sold by other types of stores such as home centers.
We hope you find this dashboard useful as a general guide to the state of our industry. Please contact us at Feedback@nkba.org if you would like to see further detail.
.


