

New Home Sales Rise in August
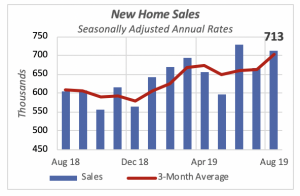
After August’s data on sales of existing homes showed a 1.3% increase, reaching its highest pace in well over a year, sales of new homes also rose in August, by 7%, to an annual rate of 713,000 homes. Even though new-home sales were higher in June, when they hit a rate of 719,000 units, the last time there was a higher level of activity in this category was November 2017, nearly two years ago.
Furthermore, the three-month performance shown in the chart below illustrates an overall rising trend in sales of new homes, which began in January with just three months of dips.
Along with the increase in new home sales, the housing markets’ health is positive. The three primary indicators for the housing market — new-home sales, existing home sales and housing starts —have all been rising recently. This is despite weakness in other economic sectors, such as manufacturing (discussed below).
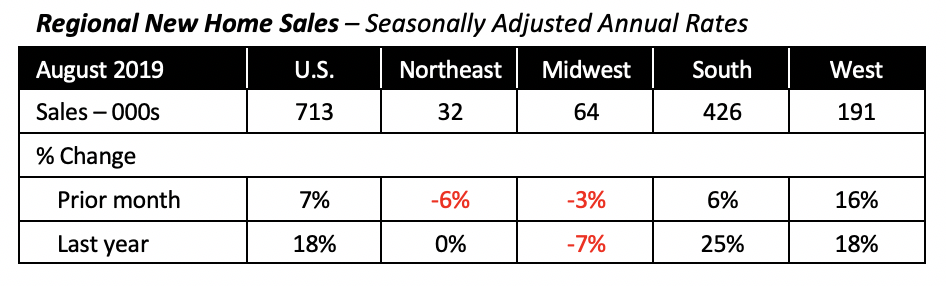
But the strength in new-home sales is not equal across the country. Regionally, sales increased in the South and the West, were flat in the Northeast but fell in the Midwest.
Sales in the West jumped the most, with a 16% increase in August to reach an annualized rate of 191,000 units. The South saw sales rise 6% to a rate of 426,000 units. These two regions generate the most housing activity, accounting jointly for 80% of new-home sales.
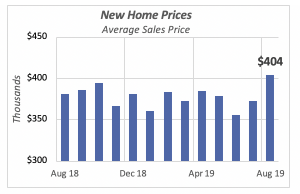
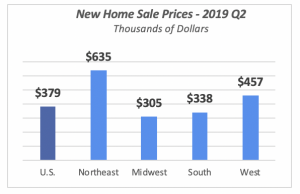
Home Prices Up, but Remain in Stable Range
The selling price of new homes firmed up in August, rising to an average of $404,000 per home. But despite this latest increase, combined with a 5% increase in July, prices remain within a range of $350,000 to $400,000, where they have remained over the last year.
There is no clear sign of a trend, positive or negative, in new home prices.
Regionally, the highest new-home prices prevail in the Northeast, where the average new home sold for $635,000 at the end of the second quarter. The lowest prices are in the Midwest, where the typical new home sold for $305,000. (Unlike national average prices, selling prices of new homes at the regional level are available only on a quarterly basis.)
One thing to note is that the price of new homes is the average sales price of a large number of homes with different characteristics. That is, the price of a new home sold might change from month to month because the homes sold could be larger, smaller or have more or fewer amenities.
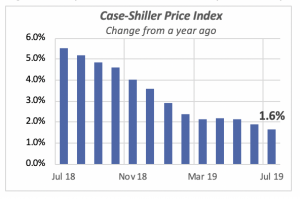
But there is a measurement of home prices that takes into account these differences in home characteristics: the Case-Shiller price index. Case-Shiller attempts to eliminate the impact of features and other factors on home prices. This index presumably eliminates all factors not related to the intrinsic value of the house; it compares the sales price of the same home over time. Of course, the index might not account for remodeling and improvements made to the house in the interim between sales transactions.
Nonetheless, the Case-Shiller index is a better indicator of the changing value of the home as an asset. The latest data shows that the rate of pricing increases has been slowing to 1.6% in July, significantly lower than the 5.5% pace that prices showed a year ago.
Manufacturing Sector Softens
While both orders and shipments for durablemanufacturing goods rose in August, their corresponding increases were minimal and reflect the perilous situation in which the manufacturing sector finds itself currently.
Shipments rose by a negligible 0.1%)to reach $254 billion for the month of August. Despite the gains made a few months back, shipments are at virtually the same level they were a year ago, only 0.3% higher than August 2018. Clearly, the foreign trade disputes, particularly with China, are having an impact on manufacturing. Exports of American goods were virtually flat in August, roughly maintaining their range of the last few months. This is in contrast with the increasing trend seen throughout 2017 and the first six months of 2018.
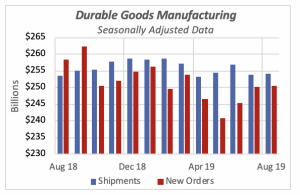
Similar to manufacturing shipments, new orders also increased minimally in August. In this case, by 0.3% compared to the previous month, to $250.7 billion. Furthermore, as represented by the red bars in the chart above, August orders were lower than the same month of 2018, when they were $258.4 billion; that is, orders in August were 0.3% below last year.
Year-to-date for the first eight months of 2019, shipments have been running 2.5% ahead of last year, totaling slightly over $2.03 trillion dollars. This is mostly on the strength of the first few months of the year, when each month’s shipments were consistently exceeding the corresponding month of the prior year.
But new orders, which are an indication of the direction shipments will take in the next few months, are running 0.4% below last year, year-to-date. New orders through August are at $1.98 trillion, lower than shipments.
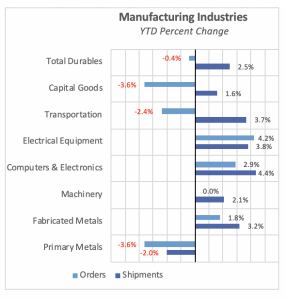
Naturally, the various sectors that comprise the manufacturing industry perform differently. Although shipments for most sectors are higher than last year, with the exception of primary metals,which is running nearly 4% below 2018, there are several where new orders lag last year’s volumes, year-to-date, illustrated in the chart below.
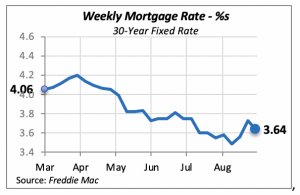
Mortgage Rates Reverse Pattern With a Dip
Mortgage rates fell for the first time in three weeks. The 30-year fixed rate fell by nine basis points to 3.64%; the 15-year rate dropped by five basis points to 3.16%, and ARMs (adjustable rate mortgages) are currently at 3.38%, down 11 basis point from the previous week.
The latest move by the Federal Reserve Bank to increase liquidity in the system will have some impact on interest rates — although it’s unclear whether that liquidity will be beneficial to the housing markets.
Manuel Gutierrez, Consulting Economist to NKBA
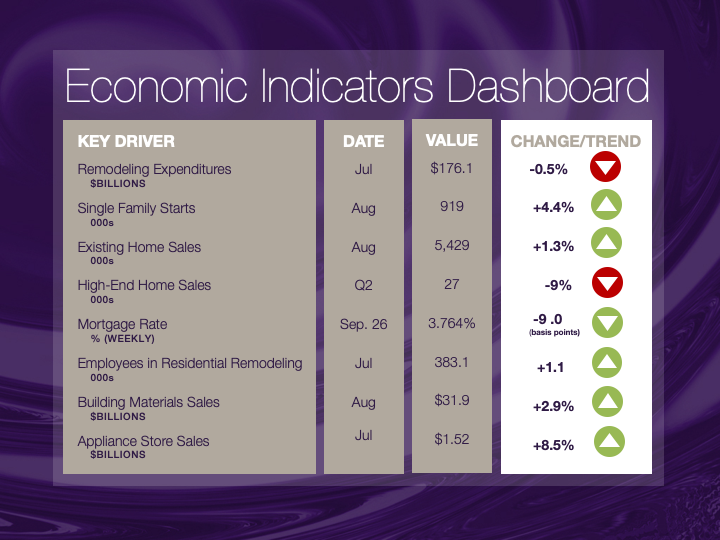
Explanation of NKBA’s Economic Indicators Dashboard
The dashboard displays the latest value of each economic indicator with a colored triangle that highlights visually the recent trend for each of the drivers. “Green” is a positive signal, indicating that the latest value is improving; “Yellow,” as it’s commonly understood, denotes caution because the variable may be changing direction; “Red” indicates that the variable in question is declining, both in its current value and in relation to the recent past.
Note that all the data, except for “mortgage rate” and “appliance-store sales” are seasonally adjusted and are represented at annual rates.
Remodeling Expenditures. This is the amount of money spent on home improvement projects during the month in question. It covers all work done for privately owned homes (excludes rentals, etc.). The data are in billions of dollars and are issued monthly by the U.S. Department of Commerce.
Single-Family Starts. This is the number of single-family houses for which construction was started in the given month. The data are in thousands of houses and are issued monthly by the U.S. Department of Commerce.
Existing-Home Sales. These data are issued monthly by the National Association of Realtors and capture the number of existing homes that were sold in the previous month.
High-End Home Sales. This series are sales of new homes priced at $500,000 and higher. The data are released quarterly by the U.S. Department of Commerce and are not seasonally adjusted. Thus, a valid comparison is made to the same quarter of prior year.
Mortgage Rate. We have chosen the rate on 30-year conventional loans that is issued by the Federal Home Loan Mortgage Corporation (known popularly as Freddie Mac.) Although there are a large number of mortgage instruments available to consumers, this one is still the most commonly used.
Employees in Residential Remodeling. This indicator denotes the number of individuals employed in construction firms that do mostly residential remodeling work.
Building-Materials Sales. These data, released monthly by the Department of Commerce, capture total sales of building materials, regardless of whether consumers or contractors purchased them. However, we should caution that the data also includes sales to projects other than residential houses.
Appliance-Store Sales.This driver captures the monthly sales of stores that sell mostly household appliances; the data are stated at an annual rate. We should not confuse this driver with total appliance sales, since they are sold by other types of stores such as home centers.
We hope you find this dashboard useful as a general guide to the state of our industry. Please contact us at Feedback@nkba.org if you would like to see further detail.


