

Housing Markets Vibrant
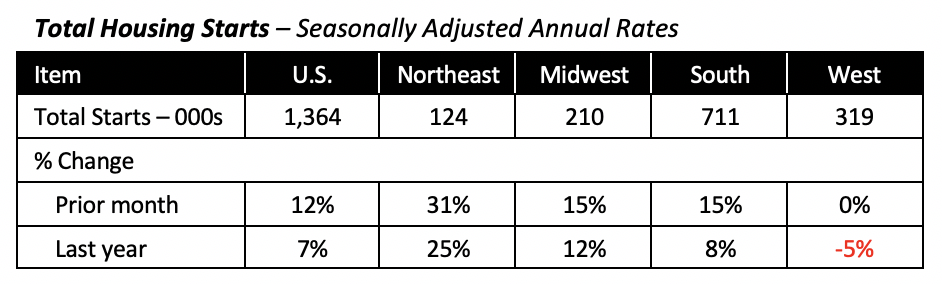
The housing markets seem to be in agreement this time. On the new construction side of the market, August brought the news that housing starts rose 12% to an annual pace of 1.36 million units, following three months of declines. And August’s is the highest pace of monthly activity in more than 12 years.
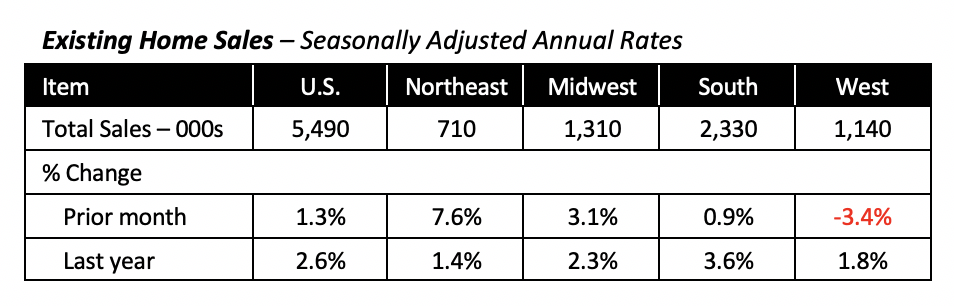
As for resales, existing home sales rose a modest 1.3% in August to an annual rate of 5.49 million units. Although this is just the second consecutive monthly increase, sales have in reality been on a general positive trend, with ups and downs, since January of this year, when home sales had hit a three-year low of 4.93 million units (annual rate; see further comments below.)
Housing Starts Reach 10-Year High
August new housing starts hit their highest pace since mid-2007, when the housing market had begun to unwind following the excesses fueled by easy credit terms, i.e. sub-prime lending, that were prevalent in the first few years of the century.
Last month’s increase has been attributed to the central bank’s lowering of borrowing costs in late July, its first drop in rates since 2008. However, mortgage rates, which have a more direct impact on home construction and home sales, have been falling since last November with minimal effect on housing construction.
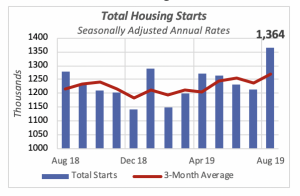
In spite of more housing construction in August, nearly 2% fewer houses have been started year-to-date compared to last year. So far this year, U.S. builders have started construction in 852,000 new houses, down from 867,000 over the same period last year.
Three of the four major regions contributed to August’s construction rebound. The only exception is the West, where housing starts were the same as the previous month. However, year-to-date through August, housing starts in the West are running 5% below last year.
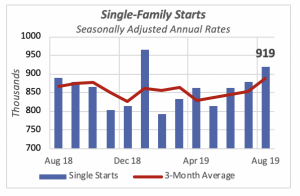
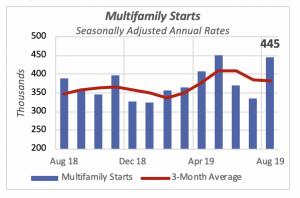
Construction of single- and multifamily housing units, the major components of new housing starts, contributed to last month’s improvement in the sector. Single-family rose to an annual rate of 919,000 units, a 4% gain over the preceding month. But construction in the volatile multifamily sector jumped by 31% to an annual pace of 445,000 units.
August was the third consecutive month of increases in single-family starts. Also, three of the four U.S. regions saw faster single-family activity in August — the only exception is the Northeast, where single-family starts fell by 2%, even though it’s only 1,000 units. This region is the least significant in new home construction, accounting for only 6% of U.S. single-family starts. It pales in comparison to the South, which accounts for over half of single-family construction, or the West, which represents over a quarter of new single-family starts.
On the multifamily side, housing starts jumped by 110,000 units to reach an annual rate of 445,000 units, the second highest in 12 months. As indicated above, this represents a 31% jump for the month, and it is a 14% increase over August 2018, when it was running at a rate of 390,000 units.
Existing Home Sales Peak
In August, sales of existing homes reached their highest level of activity in well over a year; March 2018 was the last month when the rate of sales was higher than last month’s. For August 2019, sales hit a rate of 5.49 million units, 1.3% above the prior month. This year’s accelerating pace perhaps portends higher activity in the near future.
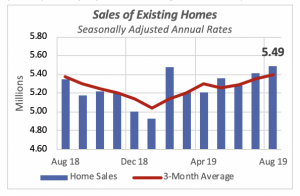
Similar to the new construction sector, existing home sales rose in three of the four regions with the exception of the West, where sales fell 3.4% from July’s pace. But sales in the four regions in August exceeded their corresponding level in the same month of last year.
Number of Bathrooms in New Homes Dips
A couple of months ago, we reviewed trends on the number of bathrooms in new homes. It was estimated that the typical new single-family home built last year has on average 2.63 bathrooms, up from 2.5 in 2004, and a more remarkable increase from the average of 1.9 bathrooms in 1973. But the data also revealed a slight decline in the number of bathrooms since 2015, mainly due to a drop in the number of homes with three or more bathrooms, which declined from 38% of all new homes in 2015 to last year’s 36%, as seen in the chart below.
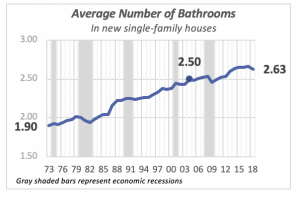
The Department of Commerce just released more detailed data that allows for deeper analysis. Thus, despite the rising popularity of homes with three or more bathrooms over the last 30 years, houses with two or two-and-a-half bathrooms remain the most popular — although their popularity has dropped from 70% of all homes in 2004 to last year’s 61%.
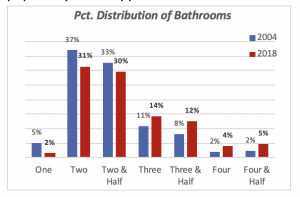
The greater popularity of new homes with three or more bathrooms can be seen in the chart above. In 2004, they accounted for 23% of all houses, but by 2018, new houses with three or more bathrooms had increased to 35%.
Mortgage Rates Edge Up Again
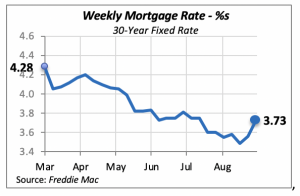
Last week, mortgage rates rose for the second consecutive week to 3.73%, an increase of 13 basis points from the prior week. This increase returns mortgage rates to the levels of just two months ago.
The Federal Reserve Board decided to drop its target interest rate by another quarter point last week, following the quarter-point drop in July, to a target range of 1.75% to 2.00%. Although the Fed indicated that consumer spending has been rising at a strong pace, both business investment and exports have weakened recently. The Fed Board thought that a reduction in interest rates, i.e. pumping more liquidity or money into the economy, might be necessary to stem a potential recession.
Manuel Gutierrez, Consulting Economist to NKBA
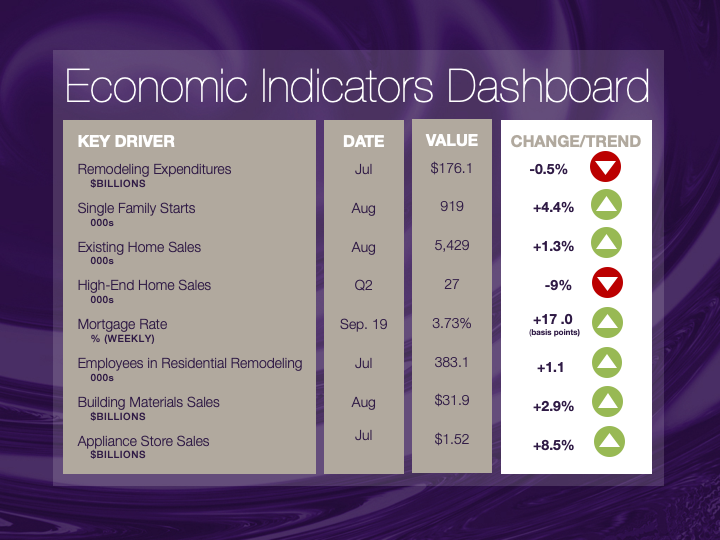
Explanation of NKBA’s Economic Indicators Dashboard
The dashboard displays the latest value of each economic indicator with a colored triangle that highlights visually the recent trend for each of the drivers. “Green” is a positive signal, indicating that the latest value is improving; “Yellow,” as it’s commonly understood, denotes caution because the variable may be changing direction; “Red” indicates that the variable in question is declining, both in its current value and in relation to the recent past.
Note that all the data, except for “mortgage rate” and “appliance-store sales” are seasonally adjusted and are represented at annual rates.
Remodeling Expenditures. This is the amount of money spent on home improvement projects during the month in question. It covers all work done for privately owned homes (excludes rentals, etc.). The data are in billions of dollars and are issued monthly by the U.S. Department of Commerce.
Single-Family Starts. This is the number of single-family houses for which construction was started in the given month. The data are in thousands of houses and are issued monthly by the U.S. Department of Commerce.
Existing-Home Sales. These data are issued monthly by the National Association of Realtors and capture the number of existing homes that were sold in the previous month.
High-End Home Sales. This series are sales of new homes priced at $500,000 and higher. The data are released quarterly by the U.S. Department of Commerce and are not seasonally adjusted. Thus, a valid comparison is made to the same quarter of prior year.
Mortgage Rate. We have chosen the rate on 30-year conventional loans that is issued by the Federal Home Loan Mortgage Corporation (known popularly as Freddie Mac.) Although there are a large number of mortgage instruments available to consumers, this one is still the most commonly used.
Employees in Residential Remodeling. This indicator denotes the number of individuals employed in construction firms that do mostly residential remodeling work.
Building-Materials Sales. These data, released monthly by the Department of Commerce, capture total sales of building materials, regardless of whether consumers or contractors purchased them. However, we should caution that the data also includes sales to projects other than residential houses.
Appliance-Store Sales.This driver captures the monthly sales of stores that sell mostly household appliances; the data are stated at an annual rate. We should not confuse this driver with total appliance sales, since they are sold by other types of stores such as home centers.
We hope you find this dashboard useful as a general guide to the state of our industry. Please contact us at Feedback@nkba.orgif you would like to see further detail.


