

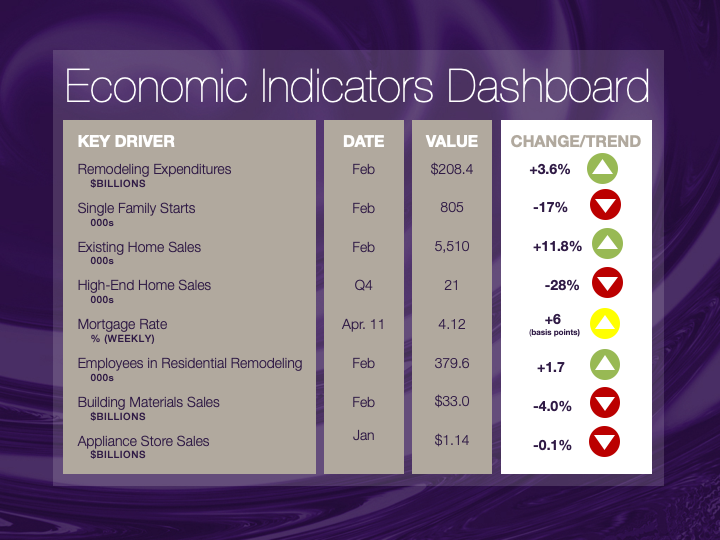
Manufacturing Shipments Creep Up as Orders Slip
Total manufacturing shipments rose in February by 0.4% to $505 billion for the month. This is the first increase after four consecutive monthly declines. Shipments hovered around $505 billion during that time, following steady, continuous increases in the prior 10 months.
In contrast to shipments, orders fell half a percentage point (0.5%) in February to $497 billion. Also, while shipments were 3.3% higher than a year ago, orders are only 1.5% above their corresponding level in February 2018.
While shipments may continue to increase, delivering the unfilled orders in manufacturers’ books, the decline in orders over the last five months is worrisome. It reflects lower demand that will translate into less manufacturing activity over the next few months.
Fortunately, the softening in orders and shipments has not yet translated into weaker demand for workers. As has been well documented, unemployment is at historic lows, with the unemployment rate at 3.8% last month. Moreover, claims for unemployment benefits are also at historic lows. Last week, only 196,000 individuals filed for unemployment, the lowest number since 1969. But it should be noted that the unemployment rate is not considered a leading indicator, as businesses will hold onto workers when demand slows because of the high costs of firing and hiring new workers.
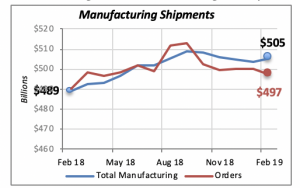
Within manufacturing, growth last month was boosted basically by only two categories: Household Appliances(+4.5%) and Primary Metals(+0.6%), as can be seen in the chart below, which displays the value of manufacturing orders and their growth in February. But these two categories represent less than 5% of total manufacturing shipments.
More important determinants of the growth in manufacturing are categories such as Transportation Equipment(e.g., automobiles, aircraft), which was down 4.5% in February but accounts for over 17% of total shipments value; that is, one of every six manufacturing dollars is generated by transportation equipment.
Another important category is Construction Materials & Supplies, which accounts for over 10% of the total value of manufacturing shipments. Although it only fell marginally by 0.2% last month.
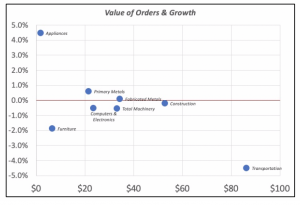
Mortgage Rates Edge Up
The 30-year fixed mortgage rate increased for the second week in a row last week, this time by four basis points to 4.12%, on the heels of an even smaller increase of 2 basis points two weeks ago.
But these increases are not a reason to worry at this time. Mortgage rates are still nearly one percentage point below what they were nearly six months ago, when they had reached 4.94% in early November.
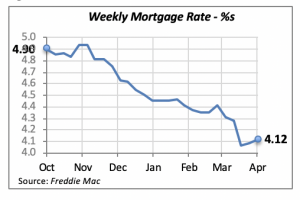
Mortgage originations are the number of mortgage loans that have been processed to grant consumers the funds to purchase or refinance a residential property. The chart below displays the number of originations, which, as can be easily seen, have steadily declined throughout last year, although more rapidly in the second half of the year.
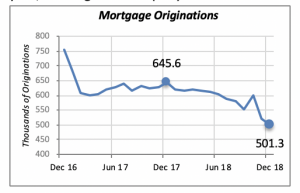
By the end of last year, the number of originations had fallen by 22% from their number in December 2017.
But while originations fell dramatically in the first half of 2017, they had stabilized through mid-2018, when they began to fall again. Unfortunately, there is no data more recent than December 2018, the impact of the recent declines in mortgage rates cannot yet be determined.
Manuel Gutierrez, Consulting Economist to NKBA
Explanation of NKBA’s Economic Indicators Dashboard
The dashboard displays the latest value of each economic indicator with a colored triangle that highlights visually the recent trend for each of the drivers. “Green” is a positive signal, indicating that the latest value is improving; “Yellow,” as it’s commonly understood, denotes caution because the variable may be changing direction; “Red” indicates that the variable in question is declining, both in its current value and in relation to the recent past.
Note that all the data, except for “mortgage rate” and “appliance-store sales” are seasonally adjusted and are represented at annual rates.
Remodeling Expenditures. This is the amount of money spent on home improvement projects during the month in question. It covers all work done for privately owned homes (excludes rentals, etc.). The data are in billions of dollars and are issued monthly by the U.S. Department of Commerce.
Single-Family Starts. This is the number of single-family houses for which construction was started in the given month. The data are in thousands of houses and are issued monthly by the U.S. Department of Commerce.
Existing-Home Sales. These data are issued monthly by the National Association of Realtors and capture the number of existing homes that were sold in the previous month.
High-End Home Sales. This series are sales of new homes priced at $500,000 and higher. The data are released quarterly by the U.S. Department of Commerce and are not seasonally adjusted. Thus, a valid comparison is made to the same quarter of prior year.
Mortgage Rate. We have chosen the rate on 30-year conventional loans that is issued by the Federal Home Loan Mortgage Corporation (known popularly as Freddie Mac.) Although there are a large number of mortgage instruments available to consumers, this one is still the most commonly used.
Employees in Residential Remodeling. This indicator denotes the number of individuals employed in construction firms that do mostly residential remodeling work.
Building-Materials Sales. These data, released monthly by the Department of Commerce, capture total sales of building materials, regardless of whether consumers or contractors purchased them. However, we should caution that the data also includes sales to projects other than residential houses.
Appliance-Store Sales.This driver captures the monthly sales of stores that sell mostly household appliances; the data are stated at an annual rate. We should not confuse this driver with total appliance sales, since they are sold by other types of stores such as home centers.
We hope you find this dashboard useful as a general guide to the state of our industry. Please contact us if you would like to see further detail.


