

Economy Keeps Chugging
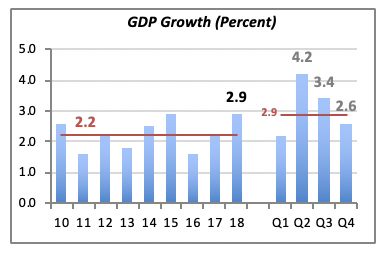
After eight years of tepid GDP growth, averaging 2.2% overall, the increase jumped to 2.9% last year. Although this was the strongest growth since 2015, when GDP also grew by 2.9%, growth has been falling on a quarterly basis recently. From a 4.2% pace in the second quarter of last year, GDP growth fell to 3.4% in Q3, and ended the year running at an even smaller rate of 2.6%.
Do the quarterly growth numbers portend a further slowdown this year? Time will tell, of course. But one of the reasons for sharp growth last year was undoubtedly the result of the 2017 end-of-year tax cut; it’s impact was felt last year as incomes and take-home pay of many consumers rose. We can’t reasonably expect a similar jump this year without an additional tax cut.
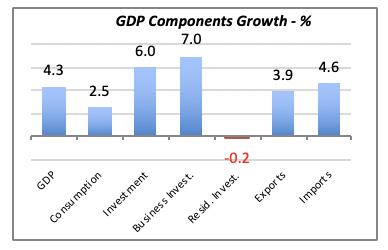
However, an important area that will continue to impact the economy this year and into the future is the robust level of business investment. Among all major components of GDP, reflected in the chart below, growth in business investment at 7% for the year was the largest. Note that overall investment was driven down by a decline in residential investment — not necessarily a positive for our businesses.
Business investment is typically not mentioned in the news as a critical factor driving future growth. Nevertheless, it not only creates future employment opportunities but also drives up productivity, which in turn will move people into higher incomes.
Looking at China as an example, large investments over the last 30 years have reduced those living under the World Bank’s poverty line of earning $1.90 a day — the Bank’s estimate of the minimum needed to survive for a day — from 67% in 1990 to a negligible 0.7% by 2015.
Homeownership Rate Continues to Rise
Along with substantial gains in employment and the strong 2018 GDP growth, the rate of homeownership rose to 64.8% in the fourth quarter. The rate increased by more than a half a percentage point (+0.6) compared to the fourth quarter of 2017. But more significantly, it was the 10th consecutive quarter of gains in homeownership.
Naturally, this is a more-than-welcome result for our industry, since homeowners —particularly those who occupy their own homes — typically spend more on the maintenance, renovation and improvement of these homes than renters or owners of rental properties do.
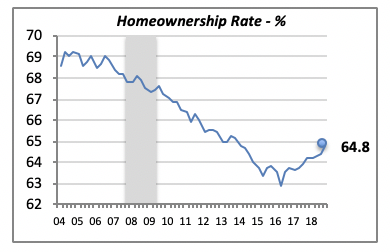
The chart above shows that the homeownership rate is recovering some of the losses suffered in the years after the 2007-2009 economic recession, shown by the gray bars.
But the 1.4% increase since Q2 of 2016 fell short of the 6.3% loss between 2014 and 2016. There’s still have a long way to go, although it’s not realistic to expect the homeownership rate will hit 69% again. This is because some of the people who became homeowners through the 1990s and early 2000s were not really qualified to own homes. It was the availability of sub-prime mortgages as well as low income or down- payment requirements that enabled many of them to purchase a home — which, all to often, was later foreclosed for non-payment. This was one of the causes of the Great Recession.
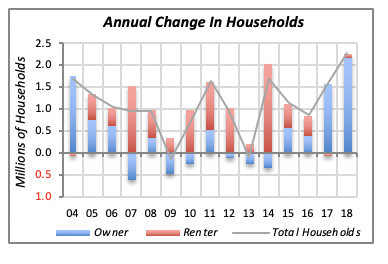
But the booming economy of the last couple of years has enabled many consumers to set up their own households, living either in a home they own themselves or in a rental unit. In fact, last year 2.28 million new households were formed.
The chart below shows the number of new households for every year since the turn of the century, highlighted by the gray line. For most years, there is a positive number of households. The exceptions are 2009 and 2013, when the number of households remained unchanged.
The bars show two distinct groups of households: owners and renters. Bars above the “zero” line indicate an increase in households and, conversely, bars below this line denote a decline in the number of households. Note that in some years, such as 2007, there was an increase of 1.5 million in the number of renters, while the number of homeowners fell by 599,000. This was the third year of the housing crash, when millions of homeowners lost their properties to foreclosure. Actually, we can appreciate this by the preponderance of years in which renters predominate; i.e., red bars above the zero line.
No Changes in Mortgage Rates
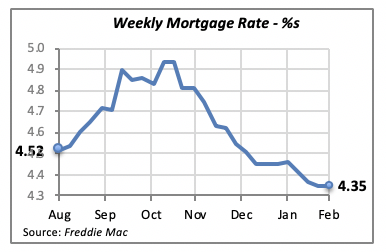
Mortgage rates remained favorable last week, unchanged from the prior week at 4.35%. No dramatic changes are expected over the next few weeks, given the wait-and-see posture by the Federal Reserve Bank.
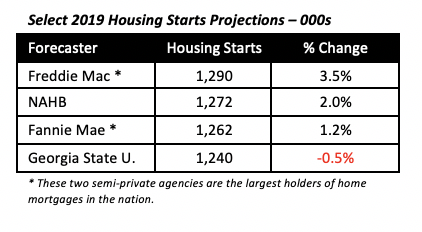
Demand for new housing, which is a prime determinant of mortgage rates, remains contained. Most economists project new housing construction to increase slightly at best this year. The table below displays several forecasts for 2019.
Manuel Gutierrez, Consulting Economist to NKBA
Explanation of NKBA’s Economic Indicators Dashboard
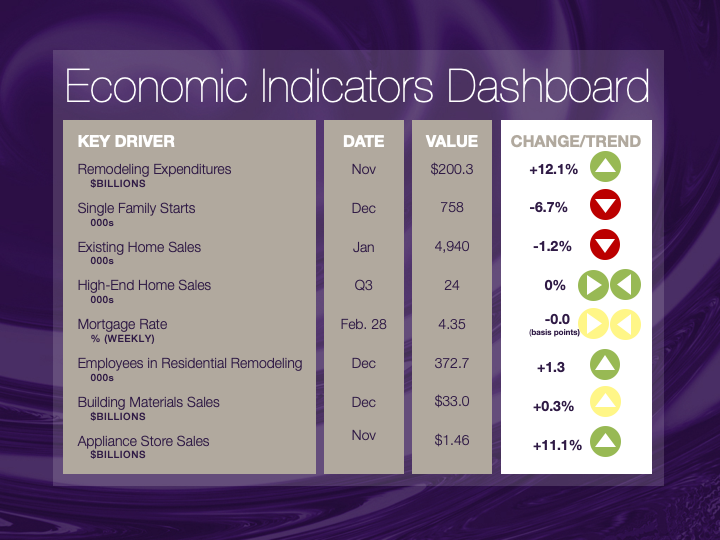
The dashboard displays the latest value of each economic indicator with a colored triangle that highlights visually the recent trend for each of the drivers. “Green” is a positive signal, indicating that the latest value is improving; “Yellow,” as it’s commonly understood, denotes caution because the variable may be changing direction; “Red” indicates that the variable in question is declining, both in its current value and in relation to the recent past.
Note that all the data, except for “mortgage rate” and “appliance-store sales” are seasonally adjusted and are represented at annual rates.
Remodeling Expenditures. This is the amount of money spent on home improvement projects during the month in question. It covers all work done for privately owned homes (excludes rentals, etc.). The data are in billions of dollars and are issued monthly by the U.S. Department of Commerce.
Single-Family Starts. This is the number of single-family houses for which construction was started in the given month. The data are in thousands of houses and are issued monthly by the U.S. Department of Commerce.
Existing-Home Sales. These data are issued monthly by the National Association of Realtors and capture the number of existing homes that were sold in the previous month.
High-End Home Sales. This series are sales of new homes priced at $500,000 and higher. The data are released quarterly by the U.S. Department of Commerce and are not seasonally adjusted. Thus, a valid comparison is made to the same quarter of prior year.
Mortgage Rate. We have chosen the rate on 30-year conventional loans that is issued by the Federal Home Loan Mortgage Corporation (known popularly as Freddie Mac.) Although there are a large number of mortgage instruments available to consumers, this one is still the most commonly used.
Employees in Residential Remodeling. This indicator denotes the number of individuals employed in construction firms that do mostly residential remodeling work.
Building-Materials Sales. These data, released monthly by the Department of Commerce, capture total sales of building materials, regardless of whether consumers or contractors purchased them. However, we should caution that the data also includes sales to projects other than residential houses.
Appliance-Store Sales.This driver captures the monthly sales of stores that sell mostly household appliances; the data are stated at an annual rate. We should not confuse this driver with total appliance sales, since they are sold by other types of stores such as home centers.
We hope you find this dashboard useful as a general guide to the state of our industry. Please contact us if you would like to see further detail.


