

Economic Data Sends Mixed Signals
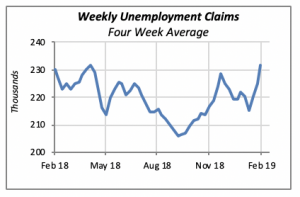
Weekly unemployment claims reversed direction two weeks ago and returned to their highest levels in more than a year. The chart below, which displays the four-week average to smooth out the weekly values, clearly shows that claims have been generally increasing since September of last year, with the exception, of course, of the declines through most of December and early January.
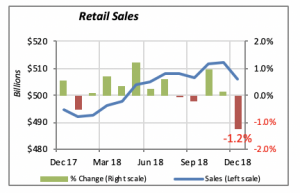
Other data released last week were also unfavorable. Retail sales fell by a substantial 1.2% in December, following increases in the preceding two months, albeit very slight, in November. However, retail sales have fallen in three of the last five months, even though they had increased steadily through July of last year.
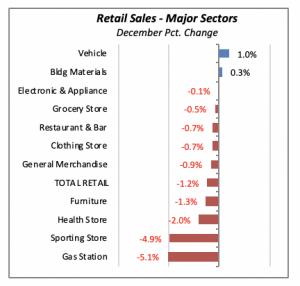
Within the various retail categories, we find that December retail sales increased in only two: Building Materials(up 0.3% for the month) and Vehicle Sales(+1%). Most other categories saw a decline in December, most notably sales at Sporting Goods Storesand at Gas Stations. Sporting Goods store sales have been declining since early 2016, and the drop in sales at Gas Stationsis due primarily to falling gasoline prices rather than a fall in the demand for gasoline. The price of gasoline fell by over 9% in December alone (crude oil prices were down 13% on the month).
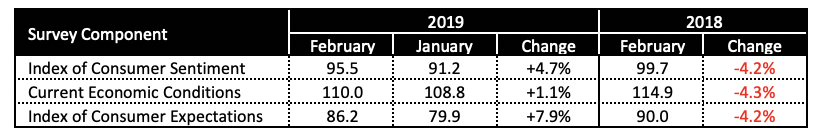
But on the plus side, favorable economic indicators show that consumer sentiment rose in February by 4.7%. According to the University of Michigan’s monthly survey of consumers, several major factors are influencing the more optimistic views held by consumers. First, there was the end of the government shutdown, even though when the survey was conducted, there were concerns about whether a new shutdown would take effect. Second, most consumers now expect fewer or no additional interest rate hikes this year. Finally, consumers have the lowest inflation expectations in over half century.
Mortgage Rates Continue Falling
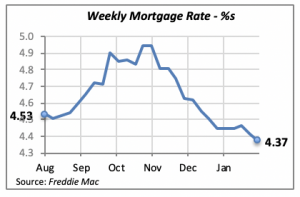
The average 30-year, fixed mortgage rate fell by 7 basis points last week to 4.37%. This decline, which may be partly driven by weaker demand, is serving as a booster for the housing markets.
Unfortunately, in the wake of the shutdown, the true state of the housing markets won’t be known for quite some time. The Department of Commerce said it will release December’s data on Feb. 26 – a full month behind its normal release. It’s unclear when January data will be available, or when the government will return to its normal schedule of releases.
Manuel Gutierrez, Consulting Economist to NKBA
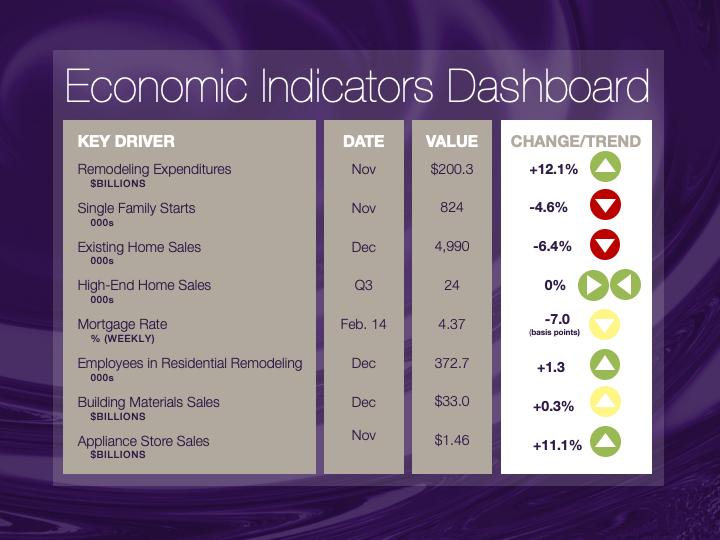
Explanation of NKBA’s Economic Indicators Dashboard
The dashboard displays the latest value of each economic indicator with a colored triangle that highlights visually the recent trend for each of the drivers. “Green” is a positive signal, indicating that the latest value is improving; “Yellow,” as it’s commonly understood, denotes caution because the variable may be changing direction; “Red” indicates that the variable in question is declining, both in its current value and in relation to the recent past.
Note that all the data, except for “mortgage rate” and “appliance-store sales” are seasonally adjusted and are represented at annual rates.
Remodeling Expenditures. This is the amount of money spent on home improvement projects during the month in question. It covers all work done for privately owned homes (excludes rentals, etc.). The data are in billions of dollars and are issued monthly by the U.S. Department of Commerce.
Single-Family Starts. This is the number of single-family houses for which construction was started in the given month. The data are in thousands of houses and are issued monthly by the U.S. Department of Commerce.
Existing-Home Sales. These data are issued monthly by the National Association of Realtors and capture the number of existing homes that were sold in the previous month.
High-End Home Sales. This series are sales of new homes priced at $500,000 and higher. The data are released quarterly by the U.S. Department of Commerce and are not seasonally adjusted. Thus, a valid comparison is made to the same quarter of prior year.
Mortgage Rate. We have chosen the rate on 30-year conventional loans that is issued by the Federal Home Loan Mortgage Corporation (known popularly as Freddie Mac.) Although there are a large number of mortgage instruments available to consumers, this one is still the most commonly used.
Employees in Residential Remodeling. This indicator denotes the number of individuals employed in construction firms that do mostly residential remodeling work.
Building-Materials Sales. These data, released monthly by the Department of Commerce, capture total sales of building materials, regardless of whether consumers or contractors purchased them. However, we should caution that the data also includes sales to projects other than residential houses.
Appliance-Store Sales.This driver captures the monthly sales of stores that sell mostly household appliances; the data are stated at an annual rate. We should not confuse this driver with total appliance sales, since they are sold by other types of stores such as home centers.
We hope you find this dashboard useful as a general guide to the state of our industry. Please contact us if you would like to see further detail.


