

Robust Jobs Report Buoys Indicators
The big news last week came from the monthly employment report, which revealed that 312,000 jobs were added in December. This brings a total of 2.64 million jobs added in 2018. This is a remarkable figure, although not the highest in recent history, as can be seen in the chart.
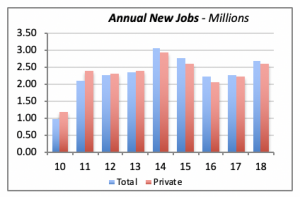
Twice since 2010, we have seen annual job growth exceeding last year’s. Once in 2014, when 3.03 million jobs were added, and then in the following year, which brought 2.74 million new jobs.
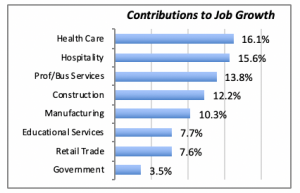
All major sectors contributed to December’s job growth. Health Care led the way with 50,200 jobs added, or 16.1% of the total. Construction added 38,000 jobs, or 12.2% of the total, even though this sector represents under 5% of all total U.S. jobs.
The main contributors to growth are listed in the chart below. It’s important to note that virtually all the growth in government employment was generated at the state or local levels; Federal government employment actually fell in December.
Of course, If the current stand-off in the trade talks with China is not resolved, or the Federal government impasse between the President and Congress remains unresolved, there might not be such robust job growth figures in the future. Right now, it’s a waiting game.
Closer to our own industry, there is reason to be optimistic. Job growth among remodeling firms has exceeded 3,000 workers for each of the last two months. This brings growth to the pattern evident for the first six months of last year, when on average, remodeling employers added 3,000 jobs each month.
November’s total remodeling employment of 356,000 workers is a historic high for the sector.
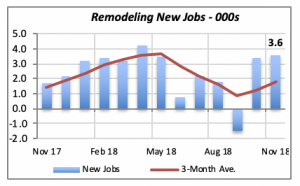
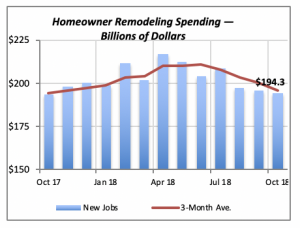
Contrasting the rebound in remodeling employment, however, spending for remodeling by homeowners fell for the three months ended in October. Note that the remodeling spending (below) data goes through October, while employment data (above) is through the month of November. This suggests that a reversal in remodeling spending could be evident once November data is released.
Concerns in Manufacturing Sector
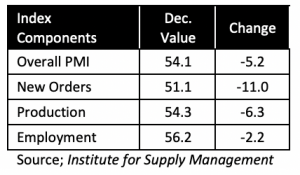
Of course, everything would be much easier if all indicators moved in the same direction — but such is not the case. December’s release of the Institute of Supply Management Index, the so-called Plumbing Manufacturers’ Index or PMI, indicated a slowdown in manufacturing activity. The index itself fell by 5.2 points in the month, to 54.1. The index is still above a value of 50, which generally means that the economy is expanding. (Conversely, a value below 50 is assumed to indicate a contracting economy.) Most components of the index, shown in the table below, fell in December, although similar to the overall index, they’re above the threshold value of 50.
Mortgage Rates Drop Further, Improving Affordability
Last week, the 30-year mortgage rate fell by 4 basis points to 4.51%, the lowest in four months. This trend is obviously a good sign for our industry, since the lower rates will make homeownership more affordable for more households.
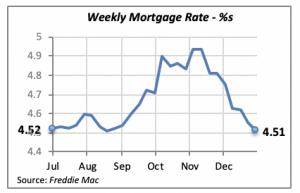
The decline since mid-November, when rates hit a recent peak of 4.94%, shaves off about $1,500 from the hypothetical annual mortgage payments for the purchase of an average existing home. The average sale price of an existing home is currently just under $300,000.
Further, there may be indications that rates could go lower still. Last week’s statements by Jerome Powell, Chairman of the Federal Reserve, suggested that the Fed’s policy emphasis could be to shore up asset prices. This means in common parlance that the Fed may be pumping more money into the economy — or at least not pulling money out —implying that interest rates may be pushed down.
Manuel Gutierrez, Consulting Economist to NKBA
Explanation of NKBA’s Economic Indicators Dashboard
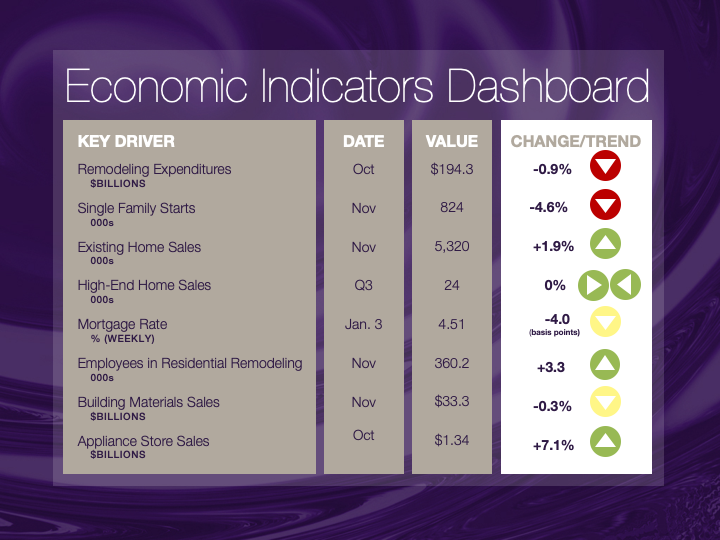
The dashboard displays the latest value of each economic indicator with a colored triangle that highlights visually the recent trend for each of the drivers. “Green” is a positive signal, indicating that the latest value is improving; “Yellow,” as it’s commonly understood, denotes caution because the variable may be changing direction; “Red” indicates that the variable in question is declining, both in its current value and in relation to the recent past.
Note that all the data, except for “mortgage rate” and “appliance-store sales” are seasonally adjusted and are represented at annual rates.
Remodeling Expenditures. This is the amount of money spent on home improvement projects during the month in question. It covers all work done for privately owned homes (excludes rentals, etc.). The data are in billions of dollars and are issued monthly by the U.S. Department of Commerce.
Single-Family Starts. This is the number of single-family houses for which construction was started in the given month. The data are in thousands of houses and are issued monthly by the U.S. Department of Commerce.
Existing-Home Sales. These data are issued monthly by the National Association of Realtors and capture the number of existing homes that were sold in the previous month.
High-End Home Sales. This series are sales of new homes priced at $500,000 and higher. The data are released quarterly by the U.S. Department of Commerce and are not seasonally adjusted. Thus, a valid comparison is made to the same quarter of prior year.
Mortgage Rate. We have chosen the rate on 30-year conventional loans that is issued by the Federal Home Loan Mortgage Corporation (known popularly as Freddie Mac.) Although there are a large number of mortgage instruments available to consumers, this one is still the most commonly used.
Employees in Residential Remodeling. This indicator denotes the number of individuals employed in construction firms that do mostly residential remodeling work.
Building-Materials Sales. These data, released monthly by the Department of Commerce, capture total sales of building materials, regardless of whether consumers or contractors purchased them. However, we should caution that the data also includes sales to projects other than residential houses.
Appliance-Store Sales.This driver captures the monthly sales of stores that sell mostly household appliances; the data are stated at an annual rate. We should not confuse this driver with total appliance sales, since they are sold by other types of stores such as home centers.
We hope you find this dashboard useful as a general guide to the state of our industry. Please contact us if you would like to see further detail.


