

Two Home Stats, Two Different Directions
Sales of existing homes, the largest component of the market, rose by 1.5% in October to reach an annualized rate of 5.22 million units sold. But sales of new homes declined by a similar percentage, 1.4%, to an annualized rate of 544,000 units. It’s difficult to discern what these seemingly contradictory statistics might mean for the economy, and how influential they are for the housing market.
Taking a perspective longer than a month’s sales, however, provides a clearer direction. The red line in the two charts below, capturing a three-month moving average, show that both of these housing markets are slowly deteriorating. There are several reasons for this turn of events, rising mortgage rates and rising house prices among them. Another cause, less immediate, is the student debt burden (discussed in some detail below).
Back to home sales, the two charts show that existing and new home sales each hit a recent peak in November 2017. Since then, sales in both categories have been gradually declining to their current levels.
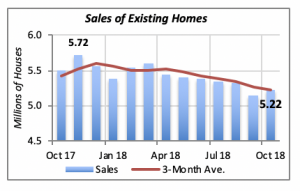
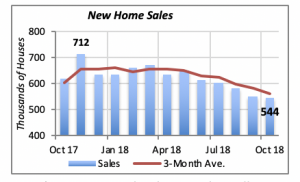
But it’s not a given that home sales will continue to fall; there are several factors that suggest otherwise.
One is that increases in house prices are decelerating. In January, house prices were moving up at a 6.3% pace, whereas today, they are increasing at a rate of 5.5% — and indication are that the pace of increases will continue to slow. A second fact is the employment situation. With more people working, it’s very likely that more of them can afford a home, or, alternatively, that housing affordability is becoming less of a hurdle for many of them.
Crushing Student Debt
Much has been said about the huge burden that many consumers are carrying as a result of borrowing to pay for a college education. Usually those comments are made in the context of overall student debt, which, as of the fourth quarter of last year, amounted to approximately $1.39 trillion — a nearly unfathomable figure.
Who holds that debt? Contrary to popular belief, not all of it is in the hands of young people.
In fact, 6% of the debt is held by people of retirement age, 60 years or older, although in some cases, this is debt incurred to help a child get through college.
The chart below displays the total debt by age group. A total of 16.8 million people who are younger than age 30 hold 28% of the total student debt; the average burden per person is $22,900, for a combined total debt for this group of $383.8 billion.
In other words, one-third of the young population who should be entering the housing market is facing a nearly-impossible obstacle because of the burden of student debt they carry. This represents one-third of young market entrants who can’t even think about purchasing a home.
Also, 12.3 million people between the ages of 30 and 39 carry student debt, or more than one-quarter of the population who could be thinking of buying or moving up to a better home, but are challenged because of their debt burden. The average debt amount per person in this group is $37,500 — significantly higher than their younger counterparts.
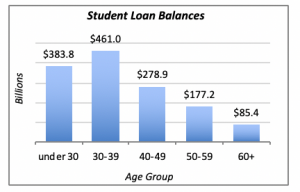
At the other end of the spectrum — people over age 60 — there are 3.2 million people carrying debt from student loans. The average amount per person is $27,000 and, as noted above, they represent about 6% of the total debt and 6% of the population of people over age 60.
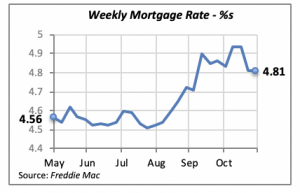
A Respite for Mortgage Rates
The 30-year fixed mortgage rate remained unchanged last week at 4.81% — welcome news for consumers who may be thinking about or who are in the process of purchasing a home.
The lack of movement in mortgage rates, however, is not the answer to weakness in the housing markets. There will not be a surge in housing construction or home buying as a consequence of the current mortgage rate. At best, consumers should expect no major changes in the direction or volume of housing construction or home sales.
Manuel Gutierrez, Consulting Economist to NKBA
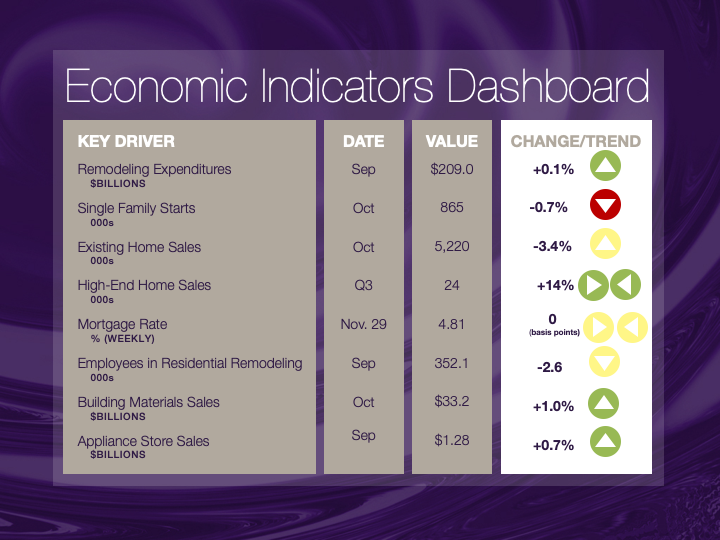
Explanation of NKBA’s Economic Indicators Dashboard
The dashboard displays the latest value of each economic indicator with a colored triangle that highlights visually the recent trend for each of the drivers. “Green” is a positive signal, indicating that the latest value is improving; “Yellow,” as it’s commonly understood, denotes caution because the variable may be changing direction; “Red” indicates that the variable in question is declining, both in its current value and in relation to the recent past.
Note that all the data, except for “mortgage rate” and “appliance-store sales” are seasonally adjusted and are represented at annual rates.
Remodeling Expenditures. This is the amount of money spent on home improvement projects during the month in question. It covers all work done for privately owned homes (excludes rentals, etc.). The data are in billions of dollars and are issued monthly by the U.S. Department of Commerce.
Single-Family Starts. This is the number of single-family houses for which construction was started in the given month. The data are in thousands of houses and are issued monthly by the U.S. Department of Commerce.
Existing-Home Sales. These data are issued monthly by the National Association of Realtors and capture the number of existing homes that were sold in the previous month.
High-End Home Sales. This series are sales of new homes priced at $500,000 and higher. The data are released quarterly by the U.S. Department of Commerce and are not seasonally adjusted. Thus, a valid comparison is made to the same quarter of prior year.
Mortgage Rate. We have chosen the rate on 30-year conventional loans that is issued by the Federal Home Loan Mortgage Corporation (known popularly as Freddie Mac.) Although there are a large number of mortgage instruments available to consumers, this one is still the most commonly used.
Employees in Residential Remodeling. This indicator denotes the number of individuals employed in construction firms that do mostly residential remodeling work.
Building-Materials Sales. These data, released monthly by the Department of Commerce, capture total sales of building materials, regardless of whether consumers or contractors purchased them. However, we should caution that the data also includes sales to projects other than residential houses.
Appliance-Store Sales.This driver captures the monthly sales of stores that sell mostly household appliances; the data are stated at an annual rate. We should not confuse this driver with total appliance sales, since they are sold by other types of stores such as home centers.
We hope you find this dashboard useful as a general guide to the state of our industry. Please contact us if you would like to see further detail.


