

Government Shutdown Stymies Data Release
The government’s partial shut-down of some agencies has impacted various business sectors in different ways. One that concerns our sector, that is not especially critical, is the release of economic and demographic data routinely gathered by various government agencies. Virtually all of that information will not be available until the government resumes.
The availability of economic data is particularly important for businesses in the construction industry that rely heavily on government issued information- such as housing starts, home sales, etc.
The first set of missing data is on the sales of new homes, which should have been released on Dec. 29. Moreover, this week, if the shutdown continues, there will be no data released on December employment and unemployment. Naturally, if the shut-down continues, more data will be affected.
Also, the majority of date on NKBA’s Economic Indicators Dashboard rely on government-issued data. These are selected because they are crucial for the residential construction and remodeling industries, plus they are readily available at no cost to anybody who may want to refer to them.
Mixed Signals from Consumers
On a monthly basis, reports on consumers’ latest views and their assessment on the general economy as well as their own financial well-being are released via two different indexes: the University of Michigan’s Consumer Sentiment Indexand the Conference Board’s Index of Consumer Confidence.
Typically, these two indexes reinforce each other by moving in the same direction, but occasionally they diverge. Such is the case with the latest release, when each index suggested an opposite consumer view on the economy, with Michigan suggesting a slight uptick and the Conference Board revealing a 6-point drop.
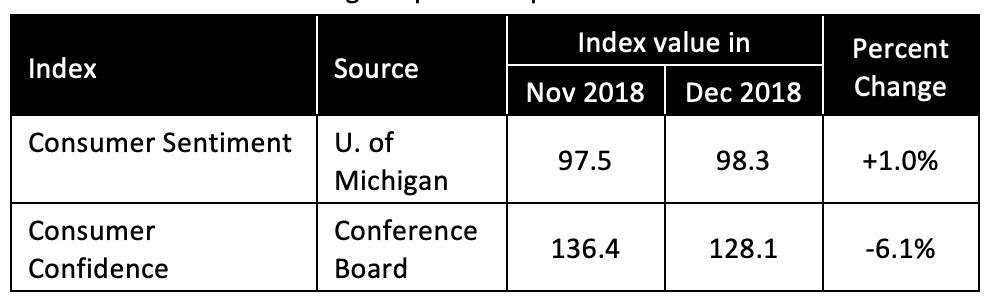
However, the decline in confidence does not imply that the economy will slow down next year — the general consensus is that expectations are still strong for growth to carry through 2019.
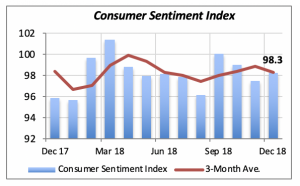
The chart below, which displays consumer sentiment, clearly shows that despite the monthly ups and down of the index, the general trend (shown by the red line) is fairly stable.
Mortgage Rate Drop Is Temporary
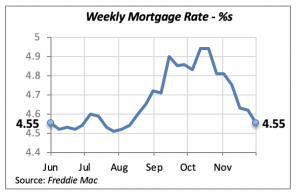
The story on mortgage rates keeps repeating itself. The 30-year fixed mortgage rate fell again last week by seven basis points, to 4.55%.
This is the sixth consecutive week of mortgage rate declines, a trend that began back in mid-November, when the rate had hit its recent peak of 4.94%. Now the rate levels more closely reflect the weak demand for housing and residential construction loans, rather than the Federal Reserve Bank’s moves to increase interest rates in general.
However, as rates continue to decline, the lower rate will make housing more affordable to some people, and encourage them to purchase a home.
Manuel Gutierrez, Consulting Economist to NKBA
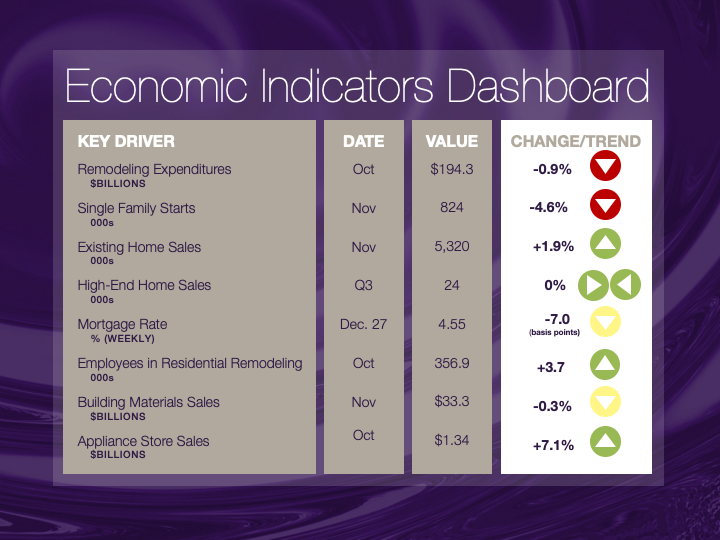
Explanation of NKBA’s Economic Indicators Dashboard
The dashboard displays the latest value of each economic indicator with a colored triangle that highlights visually the recent trend for each of the drivers. “Green” is a positive signal, indicating that the latest value is improving; “Yellow,” as it’s commonly understood, denotes caution because the variable may be changing direction; “Red” indicates that the variable in question is declining, both in its current value and in relation to the recent past.
Note that all the data, except for “mortgage rate” and “appliance-store sales” are seasonally adjusted and are represented at annual rates.
Remodeling Expenditures. This is the amount of money spent on home improvement projects during the month in question. It covers all work done for privately owned homes (excludes rentals, etc.). The data are in billions of dollars and are issued monthly by the U.S. Department of Commerce.
Single-Family Starts. This is the number of single-family houses for which construction was started in the given month. The data are in thousands of houses and are issued monthly by the U.S. Department of Commerce.
Existing-Home Sales. These data are issued monthly by the National Association of Realtors and capture the number of existing homes that were sold in the previous month.
High-End Home Sales. This series are sales of new homes priced at $500,000 and higher. The data are released quarterly by the U.S. Department of Commerce and are not seasonally adjusted. Thus, a valid comparison is made to the same quarter of prior year.
Mortgage Rate. We have chosen the rate on 30-year conventional loans that is issued by the Federal Home Loan Mortgage Corporation (known popularly as Freddie Mac.) Although there are a large number of mortgage instruments available to consumers, this one is still the most commonly used.
Employees in Residential Remodeling. This indicator denotes the number of individuals employed in construction firms that do mostly residential remodeling work.
Building-Materials Sales. These data, released monthly by the Department of Commerce, capture total sales of building materials, regardless of whether consumers or contractors purchased them. However, we should caution that the data also includes sales to projects other than residential houses.
Appliance-Store Sales.This driver captures the monthly sales of stores that sell mostly household appliances; the data are stated at an annual rate. We should not confuse this driver with total appliance sales, since they are sold by other types of stores such as home centers.
We hope you find this dashboard useful as a general guide to the state of our industry. Please contact us if you would like to see further detail.


