

Total Housing Starts Up While Single-Family Lags
In what has become a regular pattern, single-family housing starts fell in November while their counterpart, multifamily housing units, actually rose. Single-family starts fell by a disturbing 4.6% to an annual rate of 856,000 units. There hasn’t been such low rate of activity since May, and, in fact, single-family starts have been virtually falling every month since then.
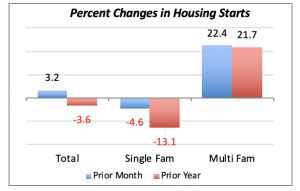
Multifamily, on the other hand, rose by a robust 22.4% last month, to its highest value in eight months. Also, November’s rate of 432,000 units is 21.7% higher than the same month last year, when builders started construction of 355,000 units, (annualized).
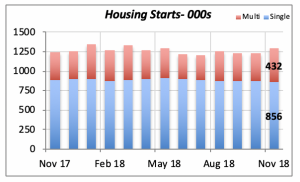
The robust increase in multifamily housing starts results in total housing starts showing a 3.2% gain in November, to reach an annual rate of 1.26 million houses. However, as noted previously, data on multifamily housing construction fluctuates sharply from month to month. That is, this 3.2% gain is not very likely indicative of a resurgent housing market.
At the same, last week’s report revealed that sales of existing homes surprisingly rose in November by 1.9%, to a rate of 5.32 million units. This gain comes on the heels of a 1.7% increase in October.
Nevertheless, while the old saw says that one month does not make a trend, it’s safe to say that two months don’t make a trend, either. The 3-month moving average in the chart below captures well the gradual decline sales of existing home over the last year (shown by the red line). The chart shows similar movement back in February and March of this year, when home sales rose in both months only to turn back to a steady decline in the following months.
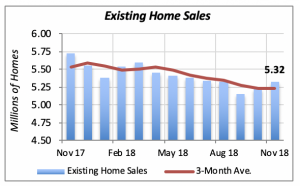
The existing homes market has been hindered by low inventory of homes for sale, combined with rising prices. Home prices in November were 4.2% higher than a year ago — the median price of an existing home was $257,000, fully $10,000 more than a year ago. Despite the increase in wage income seen over the past few quarters, these home-price increases, combined with higher mortgage rates, result in a decline in affordability. In fact, the National Association of Realtors’ affordability index stood at 143 in the third quarter, more than 12 points below its year-ago level.
Mortgage Rate Drops — But It’s Temporary
The 30-year fixed mortgage rate fell by a minimal one basis point (0.01%) to 4.62% last week. But this rate does not reflect the Federal Reserve Bank’s move to raise interest rates, indicated last Wednesday in the announcement that its policy will be to raise the Federal Funds rate by a quarter percentage point, to a range between 2.25% and 2.50%.
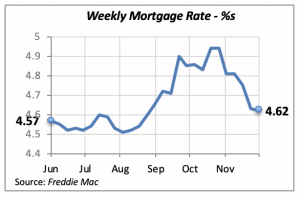
Thus, we expect that this latest policy move will result in a reversal of the decline in mortgage rates seen over the last four weeks. Moreover, the turmoil in the financial markets is bound to increase uncertainty among consumers and financial institutions, which in turn drives lending rates higher. The higher the uncertainty about the future, the more reluctant consumers and lenders are to engage in such loans.
Manuel Gutierrez, Consulting Economist to NKBA
Explanation of NKBA’s Economic Indicators Dashboard
The dashboard displays the latest value of each economic indicator with a colored triangle that highlights visually the recent trend for each of the drivers. “Green” is a positive signal, indicating that the latest value is improving; “Yellow,” as it’s commonly understood, denotes caution because the variable may be changing direction; “Red” indicates that the variable in question is declining, both in its current value and in relation to the recent past.
Note that all the data, except for “mortgage rate” and “appliance-store sales” are seasonally adjusted and are represented at annual rates.
Remodeling Expenditures. This is the amount of money spent on home improvement projects during the month in question. It covers all work done for privately owned homes (excludes rentals, etc.). The data are in billions of dollars and are issued monthly by the U.S. Department of Commerce.
Single-Family Starts. This is the number of single-family houses for which construction was started in the given month. The data are in thousands of houses and are issued monthly by the U.S. Department of Commerce.
Existing-Home Sales. These data are issued monthly by the National Association of Realtors and capture the number of existing homes that were sold in the previous month.
High-End Home Sales. This series are sales of new homes priced at $500,000 and higher. The data are released quarterly by the U.S. Department of Commerce and are not seasonally adjusted. Thus, a valid comparison is made to the same quarter of prior year.
Mortgage Rate. We have chosen the rate on 30-year conventional loans that is issued by the Federal Home Loan Mortgage Corporation (known popularly as Freddie Mac.) Although there are a large number of mortgage instruments available to consumers, this one is still the most commonly used.
Employees in Residential Remodeling. This indicator denotes the number of individuals employed in construction firms that do mostly residential remodeling work.
Building-Materials Sales. These data, released monthly by the Department of Commerce, capture total sales of building materials, regardless of whether consumers or contractors purchased them. However, we should caution that the data also includes sales to projects other than residential houses.
Appliance-Store Sales.This driver captures the monthly sales of stores that sell mostly household appliances; the data are stated at an annual rate. We should not confuse this driver with total appliance sales, since they are sold by other types of stores such as home centers.
We hope you find this dashboard useful as a general guide to the state of our industry. Please contact us if you would like to see further detail.


