

New-Home Sales Weaken
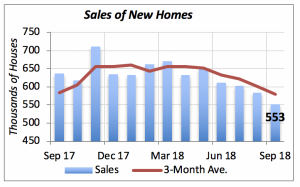
Following last week’s reported 3.4% drop in sales of existing homes, this week, data shows that sales of new homes fell, too — but by a more pronounced 5.5% — to an annualized rate of 553,000 units.
This is the fourth month of consecutive declines, and also the fifth time over the last six months that sales of new homes have fallen. New-home sales appear to have reached a peak in November 2017, when the annualized rate was 712,000 units — which was, incidentally, a pace that was the post-recession peak.
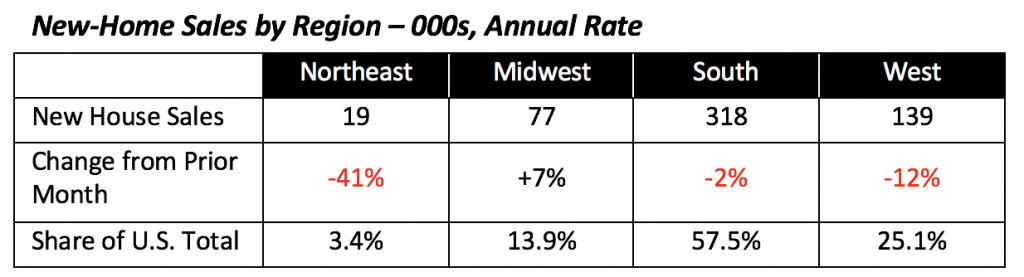
Regionally, the drop in home sales was driven by sharp declines in both the Northeast region, which saw sales plummet by 41%, and the West, which showed a 12% plunge. Sales in the largest region, the South, fell by a more modest 2%. Curiously, the Midwest was the only region bucking the trend, with a 7% increase in home sales.
But alongside the downward trend in purchases of new homes, we find that the inventory of homes for sale has been increasing steadily. Up until this past April, rising inventory levels were consistent with higher sales levels. This is reflected in the number of months’ supply, shown by the red line in the chart below, which remained more or less constant around 5.5 months until July of this year.
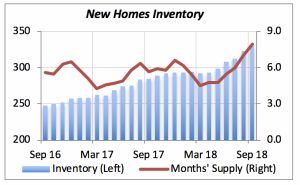
But for the last three months, the number of months’ supply has been increasing to reach 8 months in September. This is higher than the long-term average of 6 months maintained since the 1960s, suggesting that home builders are getting additional pressure to reduce production.
U.S. Economy’s Growth Remains Strong
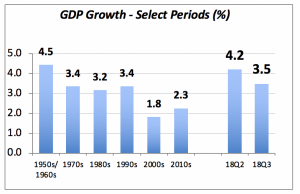
The latest data on the overall economy’s strength, however, contradicts the experience of the housing markets. Real GDP growth for the third quarter came in at a strong 3.2%, following growth of 4.2% in the second quarter. Also, growth in the last two quarters exceeds that seen since the turn of the century, when it has averaged around 2%.
The assumption that the U.S. economy was doomed to a future of virtual stagnation appears to have been dispelled. In fact, growth in the latest two quarters brings the U.S. economy to rates seen in the second half of the last century.
Still, while many sectors of the U.S. economy have contributed to, and benefitted from, fast growth, the residential construction markets have not joined the party. Traditionally, housing starts would rebound sharply after an economic recession, and lead the economic recovery. Such has not been the case in the current cycle; housing starts average a 1.25 million unit pace this year, still below the long term pre-recession average of 1.55 million units.
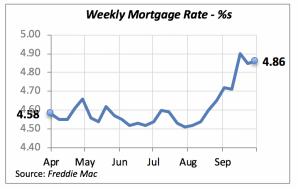
Mortgage Rates Appear to Have Stabilized
Last week, the 30-year fixed mortgage rate remained virtually unchanged, rising by a negligible one basis point (one-hundredth of a percent) to 4.86%.
However, as indicated last week, this improvement will not be sufficient to boost the housing markets significantly, and therefore, solid gains in housing construction or housing sales are not expected over the next few months.
Manuel Gutierrez, Consulting Economist to NKBA
Explanation of NKBA’s Economic Indicators Dashboard
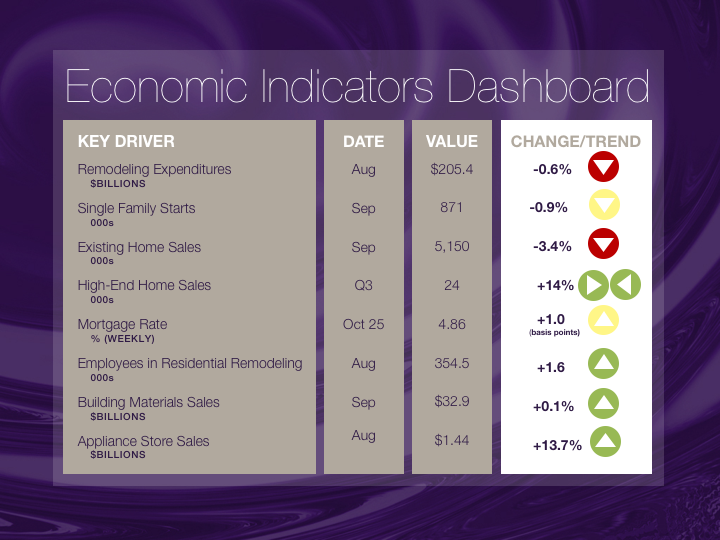
The dashboard displays the latest value of each economic indicator with a colored triangle that highlights visually the recent trend for each of the drivers. “Green” is a positive signal, indicating that the latest value is improving; “Yellow,” as it’s commonly understood, denotes caution because the variable may be changing direction; “Red” indicates that the variable in question is declining, both in its current value and in relation to the recent past.
Note that all the data, except for “mortgage rate” and “appliance-store sales” are seasonally adjusted and are represented at annual rates.
Remodeling Expenditures. This is the amount of money spent on home improvement projects during the month in question. It covers all work done for privately owned homes (excludes rentals, etc.). The data are in billions of dollars and are issued monthly by the U.S. Department of Commerce.
Single-Family Starts. This is the number of single-family houses for which construction was started in the given month. The data are in thousands of houses and are issued monthly by the U.S. Department of Commerce.
Existing-Home Sales. These data are issued monthly by the National Association of Realtors and capture the number of existing homes that were sold in the previous month.
High-End Home Sales. This series are sales of new homes priced at $500,000 and higher. The data are released quarterly by the U.S. Department of Commerce and are not seasonally adjusted. Thus, a valid comparison is made to the same quarter of prior year.
Mortgage Rate. We have chosen the rate on 30-year conventional loans that is issued by the Federal Home Loan Mortgage Corporation (known popularly as Freddie Mac.) Although there are a large number of mortgage instruments available to consumers, this one is still the most commonly used.
Employees in Residential Remodeling. This indicator denotes the number of individuals employed in construction firms that do mostly residential remodeling work.
Building-Materials Sales. These data, released monthly by the Department of Commerce, capture total sales of building materials, regardless of whether consumers or contractors purchased them. However, we should caution that the data also includes sales to projects other than residential houses.
Appliance-Store Sales.This driver captures the monthly sales of stores that sell mostly household appliances; the data are stated at an annual rate. We should not confuse this driver with total appliance sales, since they are sold by other types of stores such as home centers.
We hope you find this dashboard useful as a general guide to the state of our industry. Please contact us if you would like to see further detail.


