

Home Sales Keep Sliding
Continuing the same pattern that has been evident for most of this year, sales of existing homes fell again in September. They registered a 3.4% decline to an annual rate of 5.15 million units sold.
September’s sales drop was the largest in more than two years; February 2016 was the last time there was a plunge of greater magnitude.
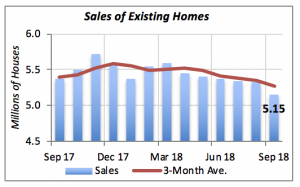
Moreover, as can be seen in the chart above, home sales have been steadily declining since this past March. September marks the seventh consecutive monthly decline. The housing slump is blamed partly on low inventory of homes for sale, although the current inventory is slightly higher than a year ago. In September, according to the National Association of Realtors, there were 1.88 million houses available for sale, a drop from 1.91 million in August.
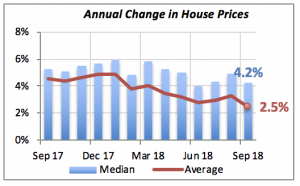
Another factor hampering sales is the steady rise in home prices. Median prices are 4.2% above last year, even though the average of the price increases appears to be slowing. The median home price was $258,100 in September, $10,500 more than a year ago.
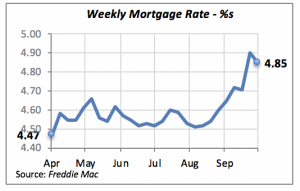
The final factor is rising mortgage rates, which reached 4.9% two weeks ago (despite a modest decline last week). Nevertheless, mortgage rates are 1 percent higher than a year ago. This basically adds approximately another $2,300 to the annual cost of a house.
Retail Sales Inch Up
Total retail sales rose 0.1% in September, matching the same growth in the previous month. For the year, retail sales are up 4.7%, despite hourly wages rising only 2.7% over the same period.
Sales of building materials also rose by 0.1% in September. But this is a sharp drop from the previous month, when sales at building materials stores had increased nearly 1 percent (0.8%).
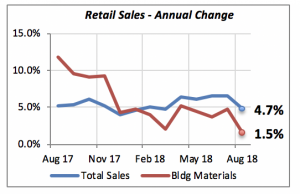
But compared to last year, retail sales have increased 4.7%, while building materials are up only 1.5%. In fact, as can be seen in the chart above, the growth in retail sales, represented by the blue line, has remained consistently around 4%. In contrast, the sales growth of building materials has been slowly deteriorating over the last year. This no doubt reflects the current weakness in the housing markets.
Mortgage Rates Moderate Slightly
Following the sharp jump in mortgage rates two weeks ago, last week’s modest decline was welcome. The average 30-year fixed mortgage rate fell by five basis points to 4.85%.
This improvement will not be sufficient to boost the housing markets significantly, however, and observers do not expect to see solid gains in residential construction or housing sales in the next few months.
Manuel Gutierrez, Consulting Economist to NKBA
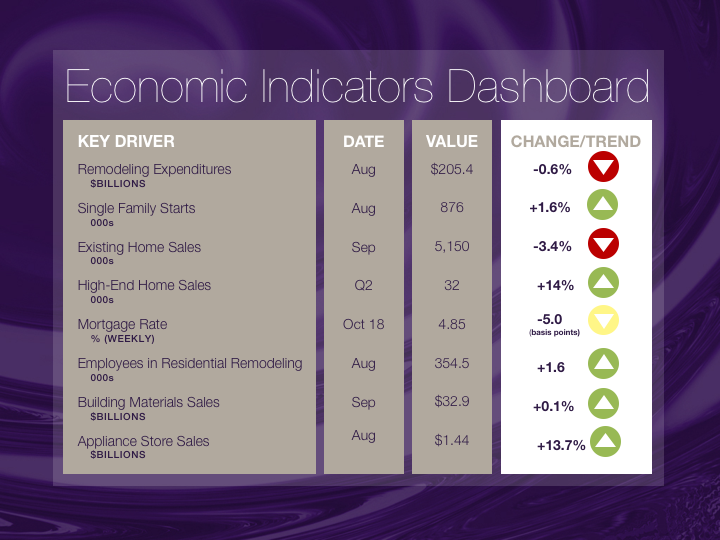
Explanation of NKBA’s Economic Indicators Dashboard
The dashboard displays the latest value of each economic indicator with a colored triangle that highlights visually the recent trend for each of the drivers. “Green” is a positive signal, indicating that the latest value is improving; “Yellow,” as it’s commonly understood, denotes caution because the variable may be changing direction; “Red” indicates that the variable in question is declining, both in its current value and in relation to the recent past.
Note that all the data, except for “mortgage rate” and “appliance-store sales” are seasonally adjusted and are represented at annual rates.
Remodeling Expenditures. This is the amount of money spent on home improvement projects during the month in question. It covers all work done for privately owned homes (excludes rentals, etc.). The data are in billions of dollars and are issued monthly by the U.S. Department of Commerce.
Single-Family Starts. This is the number of single-family houses for which construction was started in the given month. The data are in thousands of houses and are issued monthly by the U.S. Department of Commerce.
Existing-Home Sales. These data are issued monthly by the National Association of Realtors and capture the number of existing homes that were sold in the previous month.
High-End Home Sales. This series are sales of new homes priced at $500,000 and higher. The data are released quarterly by the U.S. Department of Commerce and are not seasonally adjusted. Thus, a valid comparison is made to the same quarter of prior year.
Mortgage Rate. We have chosen the rate on 30-year conventional loans that is issued by the Federal Home Loan Mortgage Corporation (known popularly as Freddie Mac.) Although there are a large number of mortgage instruments available to consumers, this one is still the most commonly used.
Employees in Residential Remodeling. This indicator denotes the number of individuals employed in construction firms that do mostly residential remodeling work.
Building-Materials Sales. These data, released monthly by the Department of Commerce, capture total sales of building materials, regardless of whether consumers or contractors purchased them. However, we should caution that the data also includes sales to projects other than residential houses.
Appliance-Store Sales.This driver captures the monthly sales of stores that sell mostly household appliances; the data are stated at an annual rate. We should not confuse this driver with total appliance sales, since they are sold by other types of stores such as home centers.
We hope you find this dashboard useful as a general guide to the state of our industry. Please contact us if you would like to see further detail.


