

Housing Markets Remain Flat
Last week’s housing report revealed that construction of new single-family housing rose by a modest 1.6% in August, and sales of existing homes remained at 5.34 million units, unchanged from the prior month. This week’s report shows that sales of new homes increased in August by 3.5% to reach an annualized rate of 629,000 houses.
This means that two of the three major indicators of the health of the residential market — home sales and housing starts— appear to have stalled. There may be fluctuations from month to month — sometimes even surprising gains — but overall, the volume of activity is running roughly at last year’s pace. The third indicator, remodeling, is doing well, however: year-to-date through August, remodeling is running 7.6% ahead of the same period in 2017.
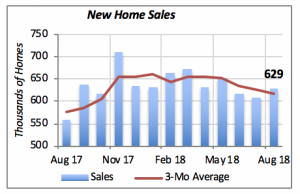
In fact, the three-month moving average in new home sales, highlighted by the red line in the chart above, shows a gradually declining trend. Moving averages such as this one are useful in that they smooth out any monthly variations that do not necessarily reflect an underlying trend.
Regionally, sales of new homes rose sharply in the Northeast. This increase is likely only temporary, however, since home sales in this region have not changed materially over the last decade. Sales in the Midwest rose a moderate 3% in August, while they were 9% higher in the West region.
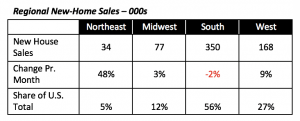
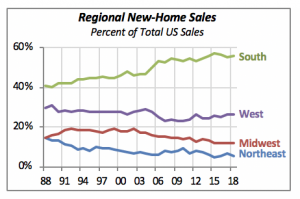
But the South — the region with most activity, accounting for over half of the nation’s new-home sales — had a 2% drop in sales to an annualized rate of 350,000 units. In fact, this region contributed to 56% of August’s home sales. Even though its share has been relatively stable over the last couple of years, the South has been capturing an increasingly significant share over the last three decades. Back in 1988, as can be seen in the chart below, the South accounted for 41% of the nation’s new-home sales. This gain has come at the expense of the other three regions, although most heavily from the Northeast region, which has lost 10 share points over this period.
Foreign Trade Deficit Escalates
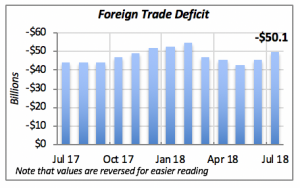
The U.S. trade deficit deteriorated further in July, reaching $50.1 billion in July — a jump of nearly 10% from the previous month, when the deficit was $45.7 billion. July’s worsening deficit is the result of a 1% drop in our exports coupled with a 0.9% increase in imports; this has been the case for several months.
It is not clear yet whether the Trump Administration’s position on trading with other nations, pressuring for what it calls a “more fair deal,” is having an impact. But the consensus among most economists is that raising tariffs on foreign goods can only have a detrimental effect on the U.S. economy — and consequently, on the global economy as well.
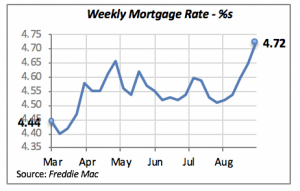
Mortgage Rates Continue Climbing
The 30-year fixed rate jumped by seven basis points to 4.72%, reaching its highest level since 2010. This increase is expected to put further pressure in the new housing markets.
Manuel Gutierrez, Consulting Economist to NKBA
Explanation of NKBA’s Economic Indicators Dashboard
Note that all the data, except for “mortgage rate” and “appliance-store sales” are seasonally adjusted and are represented at annual rates.
Remodeling Expenditures. This is the amount of money spent on home improvement projects during the month in question. It covers all work done for privately owned homes (excludes rentals, etc.). The data are in billions of dollars and are issued monthly by the U.S. Department of Commerce.
Single-Family Starts. This is the number of single-family houses for which construction was started in the given month. The data are in thousands of houses and are issued monthly by the U.S. Department of Commerce.
Existing-Home Sales. These data are issued monthly by the National Association of Realtors and capture the number of existing homes that were sold in the previous month.
High-End Home Sales. This series are sales of new homes priced at $500,000 and higher. The data are released quarterly by the U.S. Department of Commerce and are not seasonally adjusted. Thus, a valid comparison is made to the same quarter of prior year.
Mortgage Rate. We have chosen the rate on 30-year conventional loans that is issued by the Federal Home Loan Mortgage Corporation (known popularly as Freddie Mac.) Although there are a large number of mortgage instruments available to consumers, this one is still the most commonly used.
Employees in Residential Remodeling. This indicator denotes the number of individuals employed in construction firms that do mostly residential remodeling work.
Building-Materials Sales. These data, released monthly by the Department of Commerce, capture total sales of building materials, regardless of whether consumers or contractors purchased them. However, we should caution that the data also includes sales to projects other than residential houses.
Appliance-Store Sales.This driver captures the monthly sales of stores that sell mostly household appliances; the data are stated at an annual rate. We should not confuse this driver with total appliance sales, since they are sold by other types of stores such as home centers.
We hope you find this dashboard useful as a general guide to the state of our industry. Please contact us if you would like to see further detail.


