

Housing Starts Stabilize
Following the precipitous drop in single-family starts observed in June, when they fell more than 9 percent, starts edged up last month by a nearly negligible half a percentage point (+0.5%) to an annual rate of 862,000 units. Despite the recent softening of housing starts, which reflects no doubt weaker demand for new housing, single-family construction year-to-date is still running nearly 7% higher than last year.
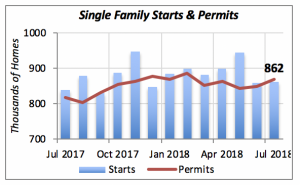
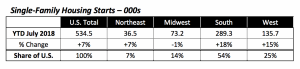
So far this year, home builders have started construction of 535,000 single-family units — 36,000 more than they built during same period last year. Three of the four U.S. regions contributed to the gain, with only the Midwest region building 1% fewer units year-to-date.
At the same time, multifamily starts, the counterpart to single-family units, fell again last month by nearly 3% to a rate of 306,000 units. This is the lowest rate of construction in a year. But again, despite the last two months’ declines, construction of multifamily housing is still running at 4.1% above last year.
Multifamily Housing Starts – 000s
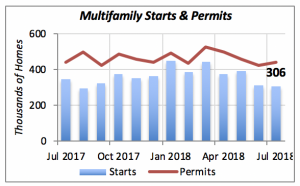
One of the reasons underlying weaker construction of multifamily units is the lower demand for rental housing. Over the last 12 months, as reported last week, the number of U.S. homeowner households increased by 2.2 million; the vast majority of them opt for single-family houses, although a number will purchase condominium units in multifamily buildings. But the number of renters, who most likely occupy apartments in multifamily buildings, increased by only 146,000 in the past year.
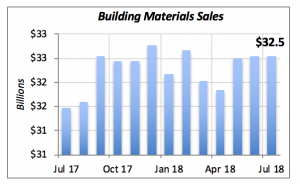
Building Materials Sales Hold Steady
Sales at building-materials stores were unchanged in July; in fact, they have remained at virtually the same level for the last three months. This no doubt partly reflects the state of new residential construction cited above, even though remodeling activity continues to bloom.
However, last week’s University of Michigan Index of Consumer Sentiment and NAHB’s Housing Market Index (HMI) confirmed declines over the past several months.
The former, shown by the blue line in the chart below, reached its lowest level since September 2017. The University reported that consumers’ assessments are driven mostly by unfavorable views of pricing for household durable goods. That is, consumers are more sensitive to price increases despite the fact that they do not anticipate inflation to accelerate over the next few months.
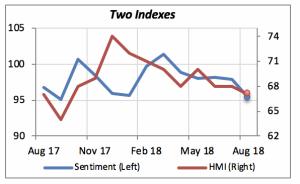
The other index displayed in the chart, the Housing Market Index, reflects the views of homebuilders. They indicate that, over the last six to eight months, home sales as well as traffic at their model homes have been declining.
Both of these indexes confirm the softening of the housing markets evident so far this year, and which is expected to prevail over the near future.
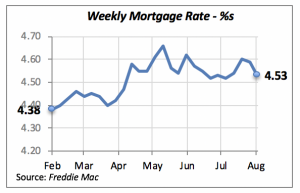
Mortgage Rates Soften Along With Housing Demand
The 30-year fixed mortgage rate eased further last week to 4.53%, down six basis points (0.06%) from the prior week. This decline is in line with other types of mortgage rates, such as adjustable rates, that also have fallen as a result of weak housing demand.
Manuel Gutierrez, Consulting Economist to NKBA
Explanation of NKBA’s Economic Indicators Dashboard
The dashboard displays the latest value of each economic indicator with a colored triangle that highlights visually the recent trend for each of the drivers. “Green” is a positive signal, indicating that the latest value is improving; “Yellow,” as it’s commonly understood, denotes caution because the variable may be changing direction; “Red” indicates that the variable in question is declining, both in its current value and in relation to the recent past.
Note that all the data, except for “mortgage rate” and “appliance-store sales” are seasonally adjusted and are represented at annual rates.
Remodeling Expenditures. This is the amount of money spent on home improvement projects during the month in question. It covers all work done for privately owned homes (excludes rentals, etc.). The data are in billions of dollars and are issued monthly by the U.S. Department of Commerce.
Single-Family Starts. This is the number of single-family houses for which construction was started in the given month. The data are in thousands of houses and are issued monthly by the U.S. Department of Commerce.
Existing-Home Sales. These data are issued monthly by the National Association of Realtors and capture the number of existing homes that were sold in the previous month.
High-End Home Sales. This series are sales of new homes priced at $500,000 and higher. The data are released quarterly by the U.S. Department of Commerce and are not seasonally adjusted. Thus, a valid comparison is made to the same quarter of prior year.
Mortgage Rate. We have chosen the rate on 30-year conventional loans that is issued by the Federal Home Loan Mortgage Corporation (known popularly as Freddie Mac.) Although there are a large number of mortgage instruments available to consumers, this one is still the most commonly used.
Employees in Residential Remodeling. This indicator denotes the number of individuals employed in construction firms that do mostly residential remodeling work.
Building-Materials Sales. These data, released monthly by the Department of Commerce, capture total sales of building materials, regardless of whether consumers or contractors purchased them. However, we should caution that the data also includes sales to projects other than residential houses.
Appliance-Store Sales. This driver captures the monthly sales of stores that sell mostly household appliances; the data are stated at an annual rate. We should not confuse this driver with total appliance sales, since they are sold by other types of stores such as home centers.
We hope you find this dashboard useful as a general guide to the state of our industry. Please contact us if you would like to see further detail.


