

Remodeling Market: Up or Down?
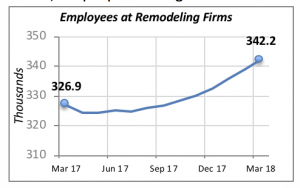
As is often the case, monthly remodeling market data sends conflicting signals. For instance, the latest employment data release, for March, reveals that the number of persons employed in residential remodeling firms rose by 3,200. This brings employment to its highest historical level — 342,200 people working in residential remodeling companies.
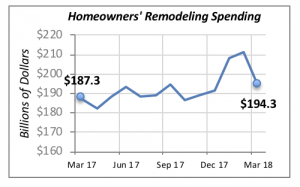
On the other hand, spending for residential remodeling by homeowners fell a disappointing 8% to an annualized rate of $194.3 billion in March. Despite this decline, spending is still higher than that of any month last year, although March’s annual rate is only 2.1% higher than last year’s total.
The Economic Expansion Continues
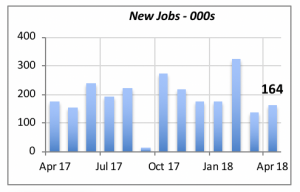
Last month’s employment data confirm, again, that the U.S. economy remains on a steady growth path. The 164,000 jobs created in April bring total U.S. employment to a new all-time record of 148.4 million people employed. But because of the huge job losses the economy suffered during the 2007-2009 recession, only 10 million net jobs have been added over the last decade.
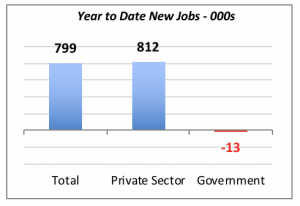
So far this year through April, private employers and government agencies have added 799,000 jobs, which is 13% higher than the same period last year, when 707,000 jobs were created in the first four months. Also, it should be noted that this growth is primarily driven by private employers who have added 812,000 jobs year-to-date, while government agencies at the federal, state and local levels have actually reduced employment by 13,000 workers over the same time period.
Further on employment news, last week’s report revealed that the unemployment rate fell by 0.2% to 3.9% — its lowest level since late 2000, right before the so-called “dot-com crash” hit the U.S. economy.
Millennials and Homeownership
There is no accurate data currently available on homeownership among Millennials; what is typically available through the press is anecdotal information. However, the latest information from the Census Bureau on homeownership hints about the status of homeownership among this group.
According to the Census Bureau’s first-quarter data, 35.3% of households headed by someone under 35 years of age own their home. This group of under-35-year-olds roughly corresponds to the Millennial population, so we can say that this 35.3% approximates the actual homeownership rate among Millennials.
The chart below shows the homeownership rate for the “under 35 years” population since 1994. It indicates that homeownership among Millennials trails far below that of previous generations. However, we should take into account that part, if not all, of the drop since 2005 is the aftermath of the housing crash along with the 2007-2009 recession.
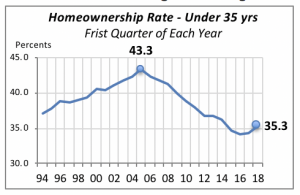
Interestingly, the rate has risen 0.7 of a point over the last two years, perhaps signaling that Millennials may be finally moving to homeownership in greater numbers.
Mortgage Rates Change Direction Again
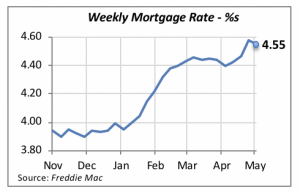
One of the leading economic indicators, the 30-year fixed mortgage rate, turned modestly favorable last week. It dipped by 0.03% to an average of 4.55%. However, this modest decline does not signify a change in the trend nor expectations of higher rates throughout this year.
Manuel Gutierrez, Consulting Economist to NKBA
Explanation of NKBA’s Economic Indicators Dashboard
The dashboard displays the latest value of each economic indicator with a colored triangle that highlights visually the recent trend for each of the drivers. “Green” is a positive signal, indicating that the latest value is improving; “Yellow,” as it’s commonly understood, denotes caution because the variable may be changing direction; “Red” indicates that the variable in question is declining, both in its current value and in relation to the recent past.
Note that all the data, except for “mortgage rate” and “appliance-store sales” are seasonally adjusted and are represented at annual rates.
Remodeling Expenditures. This is the amount of money spent on home improvement projects during the month in question. It covers all work done for privately owned homes (excludes rentals, etc.). The data are in billions of dollars and are issued monthly by the U.S. Department of Commerce.
Single-Family Starts. This is the number of single-family houses for which construction was started in the given month. The data are in thousands of houses and are issued monthly by the U.S. Department of Commerce.
Existing-Home Sales. These data are issued monthly by the National Association of Realtors and capture the number of existing homes that were sold in the previous month.
High-End Home Sales. This series are sales of new homes priced at $750,000 and higher. The data are released quarterly by the U.S. Department of Commerce and are not seasonally adjusted. Thus, a valid comparison is made to the same quarter of prior year.
Mortgage Rate. We have chosen the rate on 30-year conventional loans that is issued by the Federal Home Loan Mortgage Corporation (known popularly as Freddie Mac.) Although there are a large number of mortgage instruments available to consumers, this one is still the most commonly used.
Employees in Residential Remodeling. This indicator denotes the number of individuals employed in construction firms that do mostly residential remodeling work.
Building-Materials Sales. These data, released monthly by the Department of Commerce, capture total sales of building materials, regardless of whether consumers or contractors purchased them. However, we should caution that the data also includes sales to projects other than residential houses.
Appliance-Store Sales. This driver captures the monthly sales of stores that sell mostly household appliances; the data are stated at an annual rate. We should not confuse this driver with total appliance sales, since they are sold by other types of stores such as home centers, for instance.
We hope you find this dashboard useful as a general guide to the state of our industry. Please contact us if you would like to see further detail.


