

Home Sales Continue Downward Spiral
Sales of new homes fell again for the month of February. Even though this time the monthly decline was a modest 0.6%, since November, home sales have declined 13% to an annualized rate of 618,000 unites, off their peak of 711,000 units.
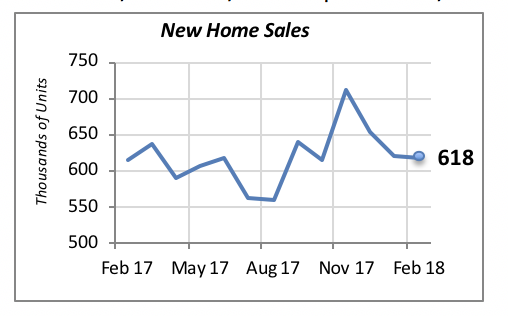
Further, as shown in the chart above, sales have retreated to levels of a year ago, when the annualized rate stood at 615,000.
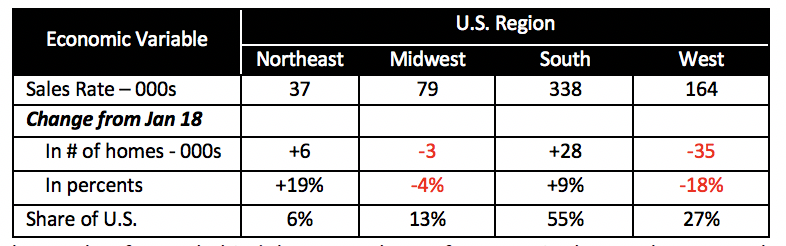
Regionally, last month’s drop was driven by declines in the Midwest and the West; the latter was the major culprit, with the biggest decline of 35,000 units (annualized). Note that this was partially offset by an increase of 28,000 home sales in the South.
These two regions, the South and the West, jointly account for more than 80% of the nation’s home sales.
The two key factors behind the poor sales performance in the new homes market are rising home prices and the builders’ focus on high-end homes. Both of these factors are interrelated. Builders are, in a sense, being forced to move upscale because their margins are being squeezed, which can be solved by offering higher-priced homes where the profit margins are more generous.
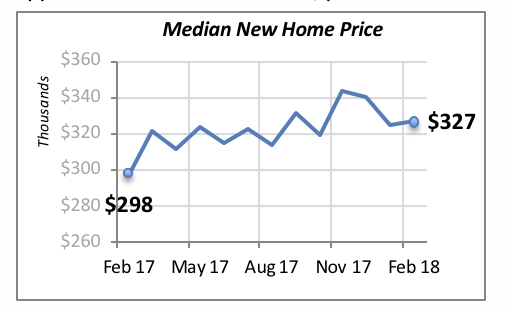
The median price of new homes rose minimally by 0.6% in February to just under $327,000. But, as can be appreciated in the chart below, prices have risen 9.7% from $298,000 a year ago.
Rising home prices will continue to prevent consumers, especially first-time homebuyers who may be renting, or younger customers who are in the process of forming a household, from owning a home. Rising mortgage rates, discussed below, will only worsen this situation.
But one component of our markets — residential remodeling — is not expected to be severely influenced by rising home prices. This is because the majority of remodeling projects are financed by consumers using their own saved funds; they do not rely on borrowing to pay for these projects.
However, tepid home sales could dampen future remodeling activity. This is because consumers are likely to remodel these newly purchased homes over the following years.
Mortgage Rates Continue Their Climb
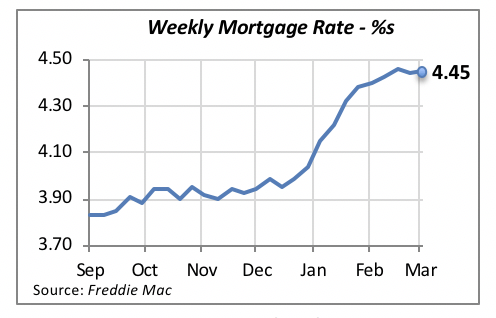
Mortgage rates resumed their expected upward trajectory, increasing last week to 4.45%, a modest one-hundredth of a percentage point from the prior week, when it averaged 4.44%.
The Federal Reserve Bank (FED) increased the Federal funds rate by one-quarter of a point under the leadership of its new chairman, Jerome Powell. This latest FED policy move targets the Federal funds rate to be in the range of 1.5% to 1.75%. Last week, before the change, it stood at 1.42% as indicated in the chart below.
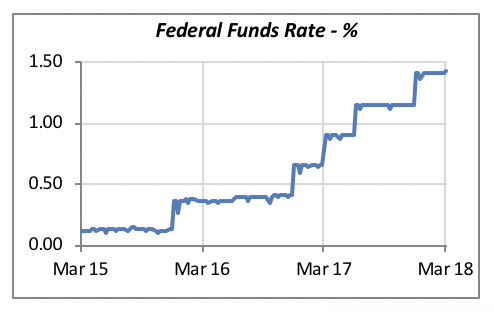
The “step” changes in the chart reflect the times that the Federal Reserve Board has increased the Fed funds rate — typically by a quarter of a point. We can see that the Fed increased rates once at the end of 2015, once again toward the end of 2016, and three times last year.
Last week’s increase is not yet reflected in the chart, as the latest data was released on the same day that the Fed announced the rate increase. But this impact will become evident in the next few weeks. Note that the Fed itself does not directly mandate the level of the funds rate, however. This is because this rate reflects the market forces of demand and supply. The Fed can only influence the rate by buying and selling Treasury bills. Thus, it will start selling T-bills, which will force their price down, and consequently yields go up.
We should only expect mortgage rates to move in one direction this year: up. This is another hurdle for the housing market, since it makes it more expensive for consumers to purchase a home.
Manuel Gutierrez, Consulting Economist to NKBA
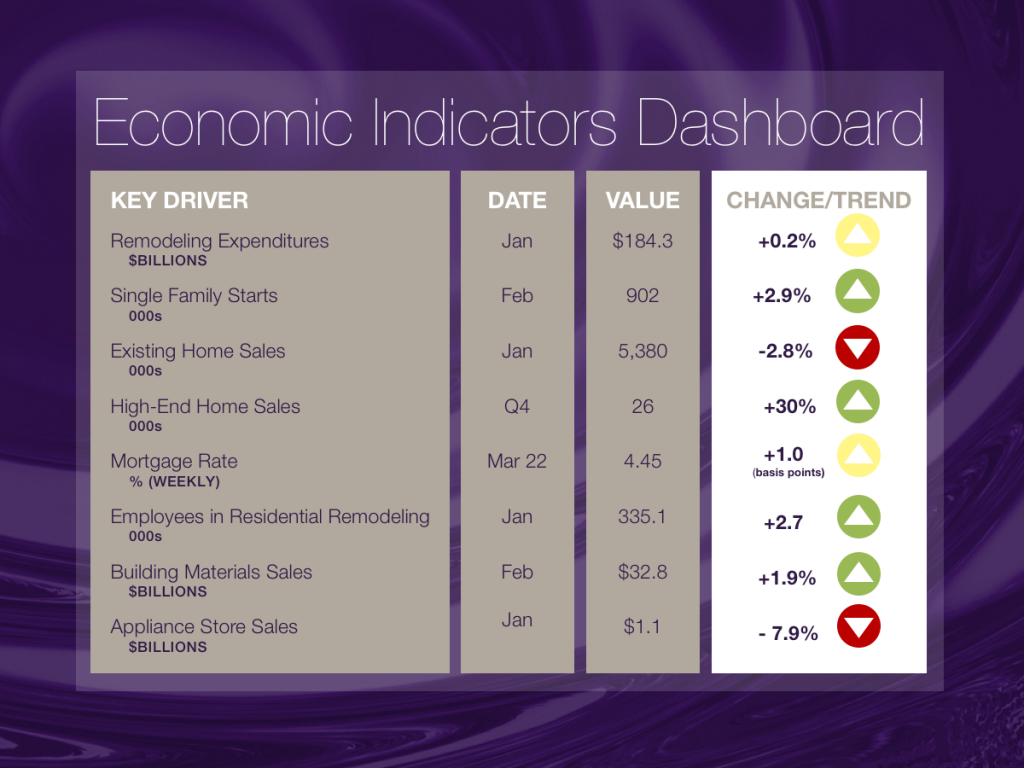
Explanation of NKBA’s Economic Indicators Dashboard
The dashboard displays the latest value of each economic indicator with a colored triangle that highlights visually the recent trend for each of the drivers. “Green” is a positive signal, indicating that the latest value is improving; “Yellow,” as it’s commonly understood, denotes caution because the variable may be changing direction; “Red” indicates that the variable in question is declining, both in its current value and in relation to the recent past.
Note that all the data, except for “mortgage rate” and “appliance-store sales” are seasonally adjusted and are represented at annual rates.
Remodeling Expenditures. This is the amount of money spent on home improvement projects during the month in question. It covers all work done for privately owned homes (excludes rentals, etc.). The data are in billions of dollars and are issued monthly by the U.S. Department of Commerce.
Single-Family Starts. This is the number of single-family houses for which construction was started in the given month. The data are in thousands of houses and are issued monthly by the U.S. Department of Commerce.
Existing-Home Sales. These data are issued monthly by the National Association of Realtors and capture the number of existing homes that were sold in the previous month.
High-End Home Sales. This series are sales of new homes priced at $750,000 and higher. The data are released quarterly by the U.S. Department of Commerce and are not seasonally adjusted. Thus, a valid comparison is made to the same quarter of prior year.
Mortgage Rate. We have chosen the rate on 30-year conventional loans that is issued by the Federal Home Loan Mortgage Corporation (known popularly as Freddie Mac.) Although there are a large number of mortgage instruments available to consumers, this one is still the most commonly used.
Employees in Residential Remodeling. This indicator denotes the number of individuals employed in construction firms that do mostly residential remodeling work.
Building-Materials Sales. These data, released monthly by the Department of Commerce, capture total sales of building materials, regardless of whether consumers or contractors purchased them. However, we should caution that the data also includes sales to projects other than residential houses.
Appliance-Store Sales. This driver captures the monthly sales of stores that sell mostly household appliances; the data are stated at an annual rate. We should not confuse this driver with total appliance sales, since they are sold by other types of stores such as home centers, for instance.
We hope you find this dashboard useful as a general guide to the state of our industry. Please contact us if you would like to see further detail.


