

Home Sales Pull Back in December
Similar to the December drop in housing starts reported last week, sales of new and existing homes also fell in the last month of 2017. Despite December’s decline, home sales have remained stable over the last year.
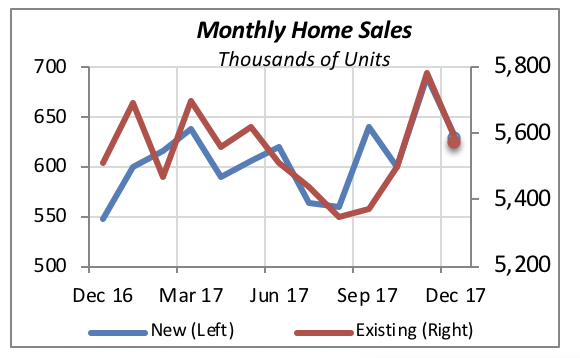
New home sales, however, ended the year at a slightly higher rate than at the beginning. In the fourth quarter, they were running at an annualized rate of 638,000 units — higher than the rate of 617,000 posted in the first quarter.
In real totals, 608,000 new homes were sold last year. (Monthly data stated above are at annualized rates.) This is 8% above 2016 sales of 581,000 units. Moreover, last year’s sales of new homes are the best in a decade — in 2007, consumers purchased 776,000 new homes.
Sales of existing homes, however, were more or less flat for the year, although still robust — a total of 5.45 million existing homes were sold, which is the highest level of home sales since 2006, when 6.48 million home sales were transacted, according to the National Association of Realtors, which collects data on existing home sales.
Sales of High-End Homes Remain Strong
Better than the 8% increase in new home sales, however, 2017 sales of high-end home jumped by 24% to 108,000 units. High-end homes are classified as those that sell for $500,000 or more. (While this may seem like an arbitrary figure, depending on market or region, it is based on data availability.)
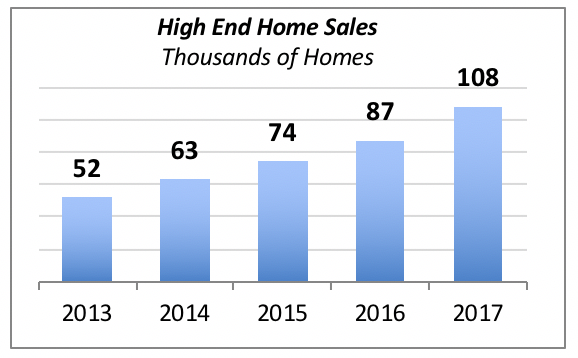
The increase in high-end homes reflects a trend toward higher-priced houses in general. Fewer homes are sold at the lower end of the scale. For instance, while in 2007, 64% of new homes sold were priced under $300,000, last year that share had dropped to 44%.
As might be expected, strong sales of high-end homes bode well for the kitchen and bath industry. Many consumers will engage in remodeling activity after they move to a newly purchased house, even if the house was recently built. They might find rooms that need to be refinished or, in some cases, adjusted to their lifestyle preferences.
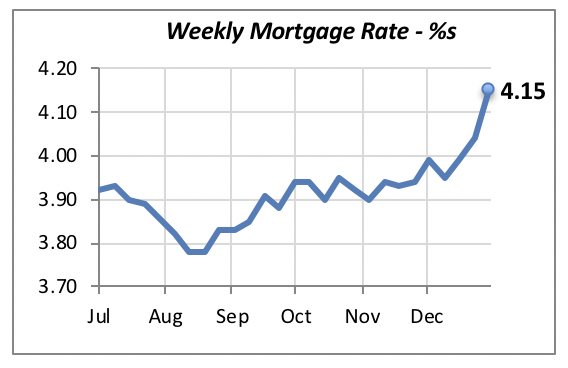
Mortgage Rates Continue to Rise
A surprising, but not totally unexpected, jump in interest rates brought the 30-year fixed mortgage rate up to 4.15. In fact, it’s been almost a year since the mortgage rate was this high — it was 4.14% at the end of March 2017.
While the increase might price some consumers out of the market, it could also temporarily boost home sales, as consumers who are on the fence about buying try to beat what they expect will be rising rates in the future — an opinion expressed in December’s consumer survey conducted by the University of Michigan.
Manuel Gutierrez, Consulting Economist to NKBA
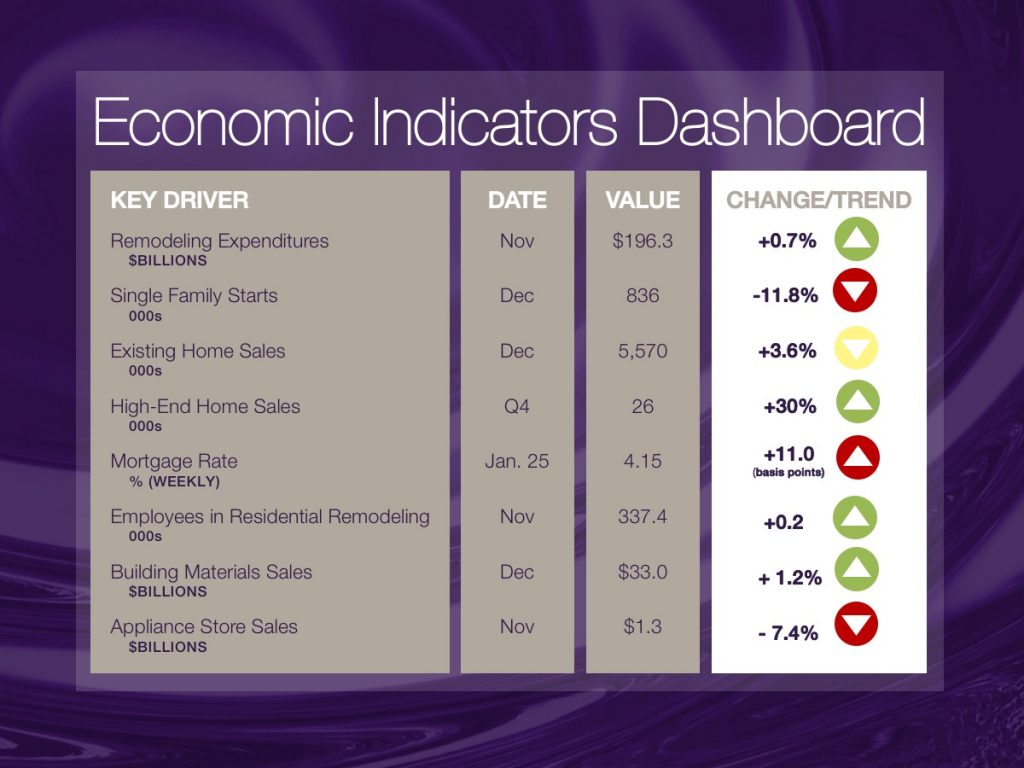
Explanation of NKBA’s Economic Indicators Dashboard
The dashboard displays the latest value of each economic indicator with a colored triangle that highlights visually the recent trend for each of the drivers. “Green” is a positive signal, indicating that the latest value is improving; “Yellow,” as it’s commonly understood, denotes caution because the variable may be changing direction; “Red” indicates that the variable in question is declining, both in its current value and in relation to the recent past.
Note that all the data, except for “mortgage rate” and “appliance-store sales” are seasonally adjusted and are represented at annual rates.
Remodeling Expenditures. This is the amount of money spent on home improvement projects during the month in question. It covers all work done for privately owned homes (excludes rentals, etc.). The data are in billions of dollars and are issued monthly by the U.S. Department of Commerce.
Single-Family Starts. This is the number of single-family houses for which construction was started in the given month. The data are in thousands of houses and are issued monthly by the U.S. Department of Commerce.
Existing-Home Sales. These data are issued monthly by the National Association of Realtors, and capture the number of existing homes that were sold in the previous month.
High-End Home Sales. This series are sales of new homes priced at $750,000 and higher. The data are released quarterly by the U.S. Department of Commerce, and are not seasonally adjusted. Thus, a valid comparison is made to the same quarter of prior year.
Mortgage Rate. We have chosen the rate on 30-year conventional loans that is issued by the Federal Home Loan Mortgage Corporation (known popularly as Freddie Mac.) Although there are a large number of mortgage instruments available to consumers, this one is still the most commonly used.
Employees in Residential Remodeling. This indicator denotes the number of individuals employed in construction firms that do mostly residential remodeling work.
Building-Materials Sales. These data, released monthly by the Department of Commerce, capture total sales of building materials, regardless of whether consumers or contractors purchased them. However, we should caution that the data also includes sales to projects other than residential houses.
Appliance-Store Sales. This driver captures the monthly sales of stores that sell mostly household appliances; the data are stated at an annual rate. We should not confuse this driver with total appliance sales, since they are sold by other types of stores such as home centers, for instance.
We hope that you find this dashboard useful as a general guide to the state of our industry. Please contact us if you would like to see further detail.


