

The latest release of homeownership data reveals that the number of U.S. households that own their home rose to 76.1 million in the 3rd quarter. This represents an additional 430,000 households that became homeowners in the period. Compared to a year ago, the rolls of homeownership have increased by 800,000 households.
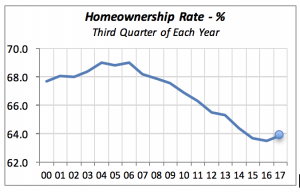
Thus, the homeownership rate increased to 63.9% in the quarter — a gain of 0.4 percent over the last four quarters. Despite this gain, the homeownership rate still is far below the peak of 69.2%, achieved in the second quarter of 2004.
As has been documented, one painful impact of the 2007-2009 recession was the millions of households whose homes were foreclosed due to the owners’ inability to keep up monthly mortgage payments. For the vast majority of these homeowners, the value of their homes fell below the amount of the mortgage.
More importantly, the equity that consumers had in their homes fell by $7.5 trillion, or roughly $100,000 per homeowner. The losses were not equally distributed, but rather were concentrated in a few geographic areas. Among the hardest hit areas in the West were Las Vegas; Reno, Nev.; Phoenix; Los Angeles and Sacramento, Calif. Southern regions that were harshly affected include Miami-Fort Lauderdale, Orlando and Atlanta, while in the Midwest, parts of Chicago and Detroit were among cities that experienced tough losses.
As a result, many of those homeowners were forced to become renters. The number of renters in the U.S. rose sharply after the recession, and while the number of homeowners rose, that was only slightly. In fact, as the chart below shows, since the turn of the century, the number of renters has increased by nearly 24%, while homeowners grew by only 5.6%.
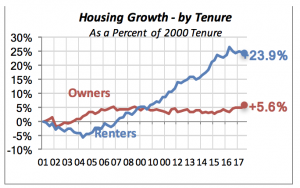
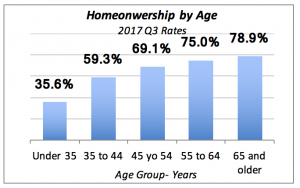
Over the last two quarters, the gains in homeownership that we can detect in the small uptick in the red line above, have been among younger people. Although Millennials saw their ownership increase by nearly 0.5 percent over the last quarter to 35.6%, it still is eight percentage points below the peak in 2004, when it was 43.6%.
The age group that displayed the largest gain was 35 –to-44-year-olds. They showed a 59.3% homeownership rate, up 0.9% from a year ago.
In contrast to recent historical performance, households among older age groups didn’t see much change in their homeownership.
These recent trends are a favorable sign to the kitchen and bath industry because homeowners — especially those who have achieved it recently — are more likely to remodel their homes, giving a boost to these and related businesses.
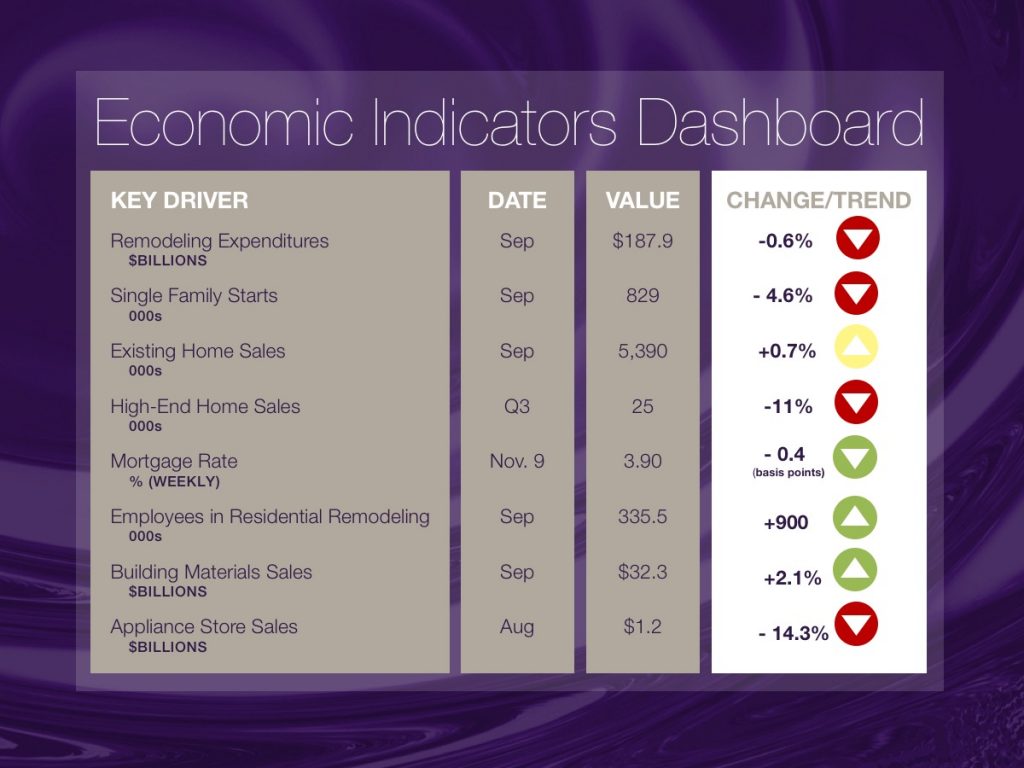
The only factor that changed in this week’s indicators table is the Weekly Mortgage Rate. It turned slightly more favorable last week by dropping 0.4%, or four basis points, to 3.9%.
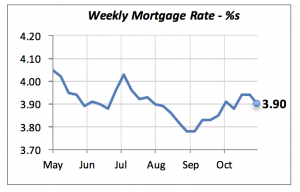
As such, at least temporarily, neither the cost of borrowing nor the mortgage rate should be discouraging either home purchases or home remodeling.
Manuel Gutierrez, Consulting Economist to NKBA
Explanation of NKBA’s Economic Indicators Dashboard
The dashboard displays the latest value of each economic indicator with a colored triangle that highlights visually the recent trend for each of the drivers. “Green” is a positive signal, indicating that the latest value is improving; “Yellow,” as it’s commonly understood, denotes caution because the variable may be changing direction; “Red” indicates that the variable in question is declining, both in its current value and in relation to the recent past.
Note that all the data, except for “mortgage rate” and “appliance-store sales” are seasonally adjusted and are represented at annual rates.
Remodeling Expenditures. This is the amount of money spent on home improvement projects during the month in question. It covers all work done for privately owned homes (excludes rentals, etc.). The data are in billions of dollars and are issued monthly by the U.S. Department of Commerce.
Single-Family Starts. This is the number of single-family houses for which construction was started in the given month. The data are in thousands of houses and are issued monthly by the U.S. Department of Commerce.
Existing-Home Sales. These data are issued monthly by the National Association of Realtors, and capture the number of existing homes that were sold in the previous month.
High-End Home Sales. This series are sales of new homes priced at $750,000 and higher. The data are released quarterly by the U.S. Department of Commerce, and are not seasonally adjusted. Thus, a valid comparison is made to the same quarter of prior year.
Mortgage Rate. We have chosen the rate on 30-year conventional loans that is issued by the Federal Home Loan Mortgage Corporation (known popularly as Freddie Mac.) Although there are a large number of mortgage instruments available to consumers, this one is still the most commonly used.
Employees in Residential Remodeling. This indicator denotes the number of individuals employed in construction firms that do mostly residential remodeling work.
Building-Materials Sales. These data, released monthly by the Department of Commerce, capture total sales of building materials, regardless of whether consumers or contractors purchased them. However, we should caution that the data also includes sales to projects other than residential houses.
Appliance-Store Sales. This driver captures the monthly sales of stores that sell mostly household appliances; the data are stated at an annual rate. We should not confuse this driver with total appliance sales, since they are sold by other types of stores such as home centers, for instance.
We hope that you find this dashboard useful as a general guide to the state of our industry. Please contact us if you would like to see further detail.


