

Last week brought forth a variety of economic data that, for a change, were mostly favorable. For instance, Gross Domestic Product (GDP), the broadest measure of economic activity, grew by a robust 3% in the third quarter. This follows a similar pace of growth in the second quarter, when GDP rose by a rate of 3.1%.
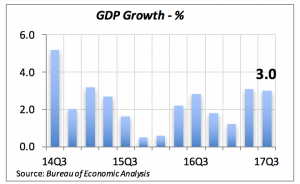
As is indicated in the chart above, growth has exceeded 3% for two consecutive quarters. It is approaching the long-term average of 3.3% and is tracking much higher than the 2.1% average growth rate recorded since the end of the 2007-2009 recession.
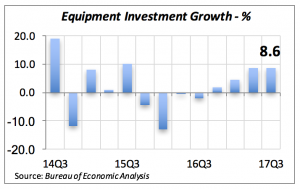
More importantly for the economy’s future growth, business investment grew sharply in the third quarter. After several quarters of negligible growth, or even declines, business investment has risen in the last two quarters.
Furthermore, one of the components of investment — investment in equipment — has approached 9% in each of the last two quarters. Investment in equipment is critical in driving the growth in productivity that leads to higher wages.
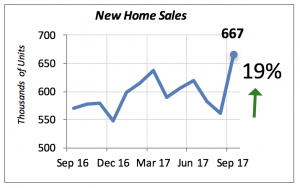
Closer to home, sales of new as well as existing homes rose in September. New home sales rose by an unusually high 19% to an annual rate of 667,000 units — the highest level in a decade.
Given the low inventory of new homes on the market, it’s not surprising to find that the number of new homes sold but whose construction hasn’t started jumped by 44% in the month. That is, the largest proportion of new home sales have not been built yet, but are already under contract.
A similar picture emerges when considering sales of new “high-end” homes, that is those valued at a minimum of $500,000. A total of 25,000 new homes at this price range were sold in the 3rd quarter, up 4% from the same quarter of 2016. (This data is not seasonally adjusted, so a comparison with Q2 is invalid.)
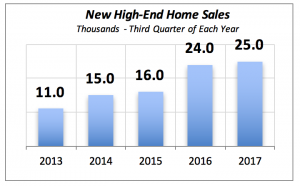
Also, year-to-date through the 3rd quarter, a total of 80,000 new high-end homes were sold, up 13% from the same period last year.
On the existing homes market, sales also rose in September, although by a nearly negligible 0.7%, reaching an annual growth rate of 5.39 million units. But this gain reverses declines in the preceding three months.
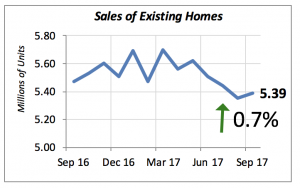
The small increase in sales of existing homes is attributable to the impact of the hurricanes that hit Florida and Texas. Home prices are up 4.2% for the 12 months ending in September.
Mortgage rates continue to rise, albeit slowly. Last week they were 3.94%, matching the value of three months ago.
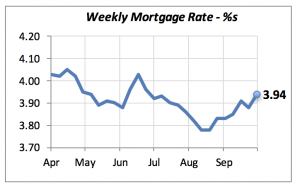
As previously indicated, these increases are not yet sufficient to put a dent in the potential growth of home sales. But if they continue, as it’s expected, they could start to impede further growth. To a great degree, it depends on the appointment of the Federal Reserve Bank’s new chairman next February.
Manuel Gutierrez, Consulting Economist to NKBA
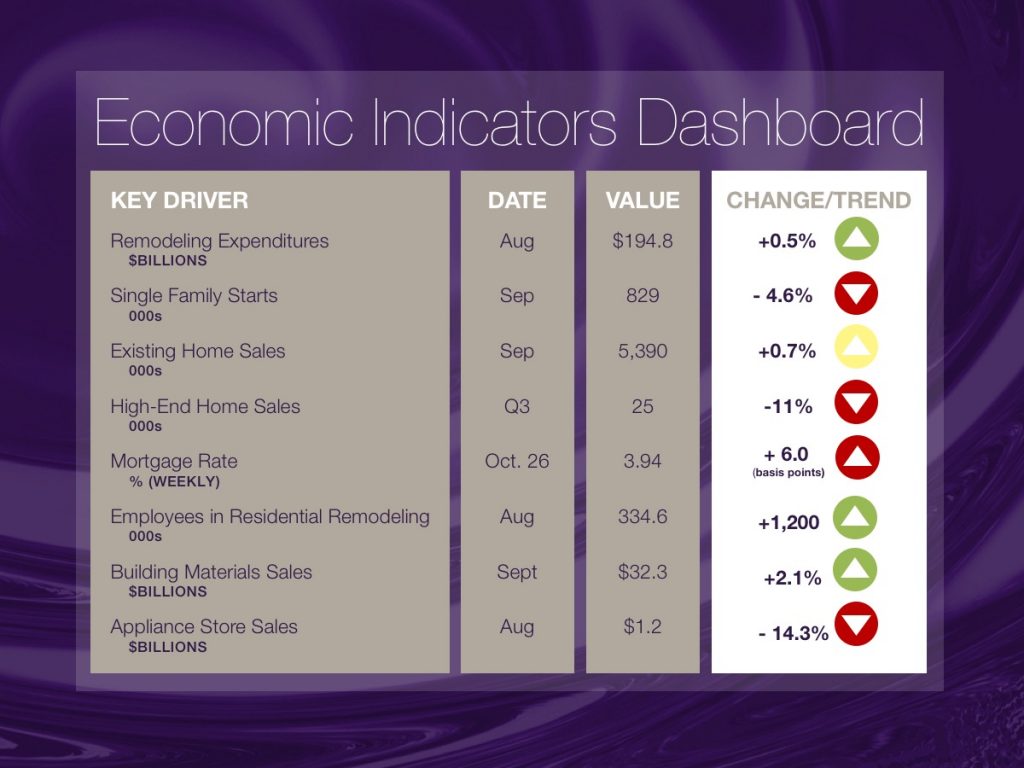
Explanation of NKBA’s Economic Indicators Dashboard
The dashboard displays the latest value of each economic indicator with a colored triangle that highlights visually the recent trend for each of the drivers. “Green” is a positive signal, indicating that the latest value is improving; “Yellow,” as it’s commonly understood, denotes caution because the variable may be changing direction; “Red” indicates that the variable in question is declining, both in its current value and in relation to the recent past.
Note that all the data, except for “mortgage rate” and “appliance-store sales” are seasonally adjusted and are represented at annual rates.
Remodeling Expenditures. This is the amount of money spent on home improvement projects during the month in question. It covers all work done for privately owned homes (excludes rentals, etc.). The data are in billions of dollars and are issued monthly by the U.S. Department of Commerce.
Single-Family Starts. This is the number of single-family houses for which construction was started in the given month. The data are in thousands of houses and are issued monthly by the U.S. Department of Commerce.
Existing-Home Sales. These data are issued monthly by the National Association of Realtors, and capture the number of existing homes that were sold in the previous month.
High-End Home Sales. This series are sales of new homes priced at $750,000 and higher. The data are released quarterly by the U.S. Department of Commerce, and are not seasonally adjusted. Thus, a valid comparison is made to the same quarter of prior year.
Mortgage Rate. We have chosen the rate on 30-year conventional loans that is issued by the Federal Home Loan Mortgage Corporation (known popularly as Freddie Mac.) Although there are a large number of mortgage instruments available to consumers, this one is still the most commonly used.
Employees in Residential Remodeling. This indicator denotes the number of individuals employed in construction firms that do mostly residential remodeling work.
Building-Materials Sales. These data, released monthly by the Department of Commerce, capture total sales of building materials, regardless of whether consumers or contractors purchased them. However, we should caution that the data also includes sales to projects other than residential houses.
Appliance-Store Sales. This driver captures the monthly sales of stores that sell mostly household appliances; the data are stated at an annual rate. We should not confuse this driver with total appliance sales, since they are sold by other types of stores such as home centers, for instance.
We hope that you find this dashboard useful as a general guide to the state of our industry. Please contact us if you would like to see further detail.


