

The Bureau of Economic Analysis revised first quarter GDP data to 1.2 percent. This revision indicates that the economy grew faster than previously thought, but still lags the 2.1 percent rate seen over the last three years.
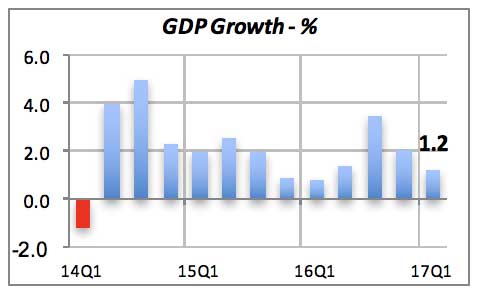
Spending by consumers rose less than 1 percent in the first quarter (six-tenths of a point or +0.6 percent). This is below the normal average of over 3 percent growth in consumer spending. Another contributor to slow growth is a decline in government spending, which fell by 1.1 percent. This is good news, however, since it implies that the federal government may be getting a handle on its finances. Slow growth today implies stronger growth in the future.
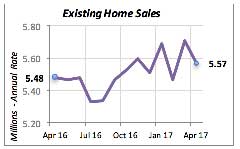
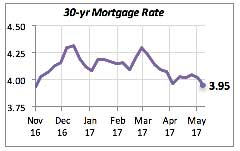
Closer to our industry, we learned last week that sales of homes, both existing and new houses, fell in April, despite falling mortgage rates (see comments on mortgage rates below). Sales of existing homes dropped 2.5 percent to 5.57 million units (annual rate); this is roughly the pace we’ve seen over the last six months, ignoring the month-to-month fluctuations.
The National Association of Realtors, who compile existing home sales data, attributes the decline to the low inventory levels of homes for sale.
Sales of new homes fell by 11 percent in April. This decline, which came after three months of appreciable gains, brought home sales to a rate close to what it was in the second half of 2016.
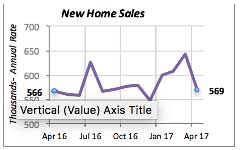
However, unlike the situation in the existing homes market, low inventory does not seem to be a factor because homebuilders can sell a home before it is even started. If there were supply constraints, we should expect the number of houses sold but not started to rise. This has not been the case recently. Historically, going back to the late 1990s, just under one-third of the new houses sold had not been started when the sale took place. The average over the last 28 years is 31 percent, this year the average is 30 percent.
As we mentioned above, mortgage rates remain favorable. They dropped seven basis points from 4.02 percent to 3.95 percent last week. This is the lowest level since late November of last year.
Visit the NKBA website to view the latest economic and industry research available to NKBA members.
Manuel Gutierrez, Consulting Economist to NKBA, economist@nkba.org
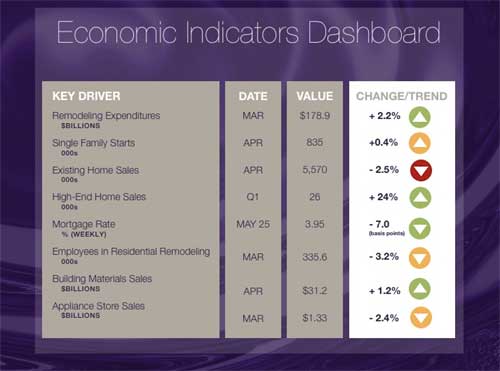
Explanation of NKBA’s Economic Indicators Dashboard
The dashboard displays the latest value of each economic indicator. Note that all the data, except for “mortgage rate” and “appliance store sales” are seasonally adjusted and are represented at annual rates.
Remodeling Expenditures. This is the amount of money spent on home improvement projects during the month in question. It covers all work done for privately-owned homes (excludes rentals, etc.). The data are in billions of dollars and are issued monthly by the U.S. Department of Commerce.
Single Family Starts. It is the number of single family houses for which construction was started in the given month. The data are in thousands of houses and are issued monthly by the U.S. Department of Commerce.
Existing Home Sales. These data are issued monthly by the National Association of Realtors, and capture the number of existing homes that were sold in the previous month.
High-End Home Sales. This series represents sales of new homes priced at $750,000 and over. The data are released quarterly by the U.S. Department of Commerce, and are not seasonally adjusted. Thus, a valid comparison is made to the same quarter of prior year.
Mortgage Rate. We have chosen the rate on 30-year conventional loans that is issued by the Federal Home Loan Mortgage Corporation (known popularly as Freddie Mac.) Although there are a large number of mortgage instruments available to consumers, this one is still the most commonly used.
Employees in Residential Remodeling. This indicator denotes the number of individuals employed in construction firms that do mostly residential remodeling work.
Building Materials Sales. These data, released monthly by the Department of Commerce, capture the total sales of building materials, regardless of whether consumers or contractors purchased them. However, we should caution that the data also include sales to projects other than residential houses.
Appliance Store Sales. This driver captures the monthly sales of stores that sell mostly household appliances; the data are stated at an annual rate. We should not confuse this driver with total appliance sales, since they are sold by other types of stores such as Home Centers.
We hope that you find this dashboard useful as a general guide to the state of our industry. Please contact us if you would like to see further detail.


