

Construction of single family homes is nearly 9 percent ahead of this time last year.
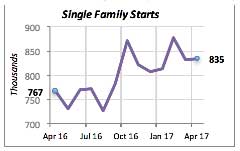
But, housing permits, usually an indicator of future housing starts, fell by 4.5 percent in April to an annual rate of 789,000. Also, similar to housing starts, permits have been relatively flat over the last few months.
Multifamily starts fell for the fourth consecutive month to a 337,000 annual rate. Despite expectations of a strong multifamily market, driven by demand for rental housing by young households, this segment of the construction market seems to be contracting.
Mortgage rates remain stable at roughly the same level we have seen over the last five weeks, hovering around 4 percent. Last week they fell by 3 basis points (i.e., three-hundredths of a percent) to 4.02 percent.
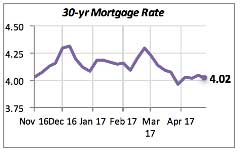
We have stated previously that mortgage rates are not hindering growth in new home construction, home sales or remodeling. They are still favorable to these activities.
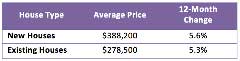
However, the average home price, both new and existing, has increased around 5.5 percent over the last 12 months (see table below). Average wages for American workers only rose 2.5 percent over the same time period. This comparison suggests that some people are less able to afford a house today than a year ago.
Another way to look at the affordability of housing is via the Housing Affordability Index issued by the National Association of Realtors. The index has fallen by 8 percent over the last year from a value of 172.3 in March 2016 to its latest value of 158.2 this past March.
These measures simply indicate that it is more difficult for some consumers to purchase a home.
Visit the NKBA website to view the latest economic and industry research available to NKBA members.
Manuel Gutierrez, Consulting Economist to NKBA, economist@nkba.org
Explanation of NKBA’s Economic Indicators Dashboard
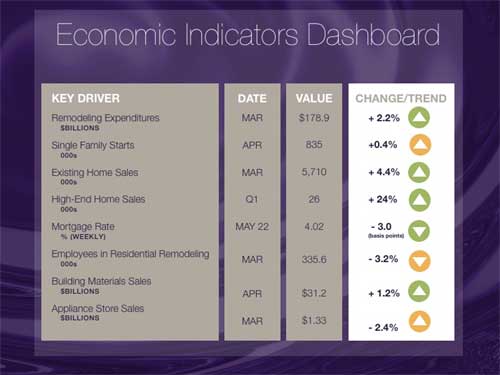
The dashboard displays the latest value of each economic indicator. Note that all the data, except for “mortgage rate” and “appliance store sales” are seasonally adjusted and are represented at annual rates.
Remodeling Expenditures. This is the amount of money spent on home improvement projects during the month in question. It covers all work done for privately-owned homes (excludes rentals, etc.). The data are in billions of dollars and are issued monthly by the U.S. Department of Commerce.
Single Family Starts. It is the number of single family houses for which construction was started in the given month. The data are in thousands of houses and are issued monthly by the U.S. Department of Commerce.
Existing Home Sales. These data are issued monthly by the National Association of Realtors, and capture the number of existing homes that were sold in the previous month.
High-End Home Sales. This series represents sales of new homes priced at $750,000 and over. The data are released quarterly by the U.S. Department of Commerce, and are not seasonally adjusted. Thus, a valid comparison is made to the same quarter of prior year.
Mortgage Rate. We have chosen the rate on 30-year conventional loans that is issued by the Federal Home Loan Mortgage Corporation (known popularly as Freddie Mac.) Although there are a large number of mortgage instruments available to consumers, this one is still the most commonly used.
Employees in Residential Remodeling. This indicator denotes the number of individuals employed in construction firms that do mostly residential remodeling work.
Building Materials Sales. These data, released monthly by the Department of Commerce, capture the total sales of building materials, regardless of whether consumers or contractors purchased them. However, we should caution that the data also include sales to projects other than residential houses.
Appliance Store Sales. This driver captures the monthly sales of stores that sell mostly household appliances; the data are stated at an annual rate. We should not confuse this driver with total appliance sales, since they are sold by other types of stores such as Home Centers.
We hope that you find this dashboard useful as a general guide to the state of our industry. Please contact us if you would like to see further detail.


