

Last week’s release of January’s data on homeowners’ spending for remodeling projects brought both good and bad news. The good news is the data for November and December of last year were revised upward by 4 percent and 5 percent respectively. The bad news is January’s spending fell by 1 percent to $159 billion.
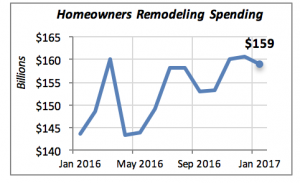
Even with January’s modest decline, spending in the last three months is at its highest level ever. This indicates that homeowners are spending record amounts for remodeling their homes. In fact, the spending rate for the three months ending in January is nearly 8 percent above that of the prior 12 months.
This level of homeowner remodeling spending is in line with the projections from Harvard’s Joint Center for Housing Studies which call for a 6.9 percent increase in total home improvement spending this year.
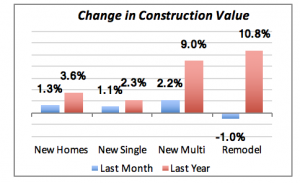
Remodeling spending is nearly 11 percent higher than January 2016, while new residential construction is up 3.6 percent compared to a year ago. In the chart below, note that the gain in new residential construction comes mostly from the multifamily side. The latter’s spending in January of this year is 9 percent above last year, much higher than spending on new single family houses.
According to the Bureau of Economic Analysis, Personal income rose 0.4 percent in January. Although If we only include income resulting from employment, personal income actually fell by 0.1 percent for the month. The difference is made up by so-called “transfer” payments such as Social Security.
But how much of this income is available to spend? Real Disposable Personal Income, the amount that Americans have available for either spending or saving, actually fell by 0.2 percent in January as calculated on a per capita basis. This is shown in the chart below.
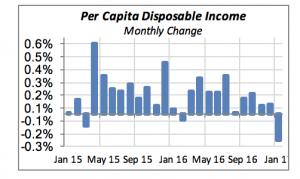
Even ignoring January’s drop, we can easily see that income growth has been slowly declining. Unless this changes, we may be facing another year of slow growth in 2017.
Also note that the much-touted gains in the stock market do not necessarily mean an increase in income. Stock market gains indicate increases in wealth for those who have a stake in the market either through their 401Ks or because they invest in shares of companies. Those gains only become income if the share owners decide to cash in.
Despite the Fed sending more signals that higher interest rates are in the horizon, the 30-year mortgage rate fell by six basis points last week, to 4.1 percent. This is back to the level they were at nearly two months ago, in the middle of January.
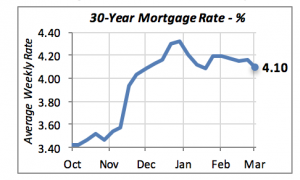
Mortgage rates reached a high of 4.32 percent at the end of last year. Since then, as shown in the chart above, they have moved in a more favorable direction.
Manuel Gutierrez, Consulting Economist to NKBA
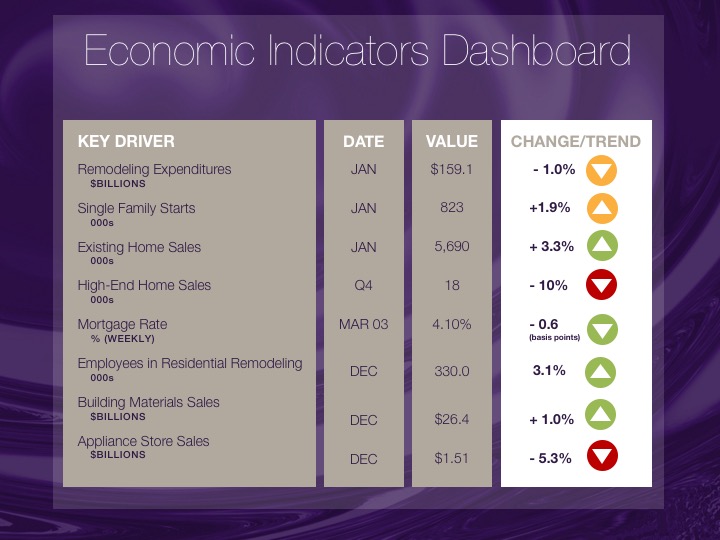
Explanation of NKBA’s Economic Indicators Dashboard
The dashboard displays the latest value of each economic indicator. Note that all the data, except for “mortgage rate” and “appliance store sales” are seasonally adjusted and are represented at annual rates.
Remodeling Expenditures. This is the amount of money spent on home improvement projects during the month in question. It covers all work done for privately-owned homes (excludes rentals, etc.). The data are in billions of dollars and are issued monthly by the U.S. Department of Commerce.
Single Family Starts. It is the number of single family houses for which construction was started in the given month. The data are in thousands of houses and are issued monthly by the U.S. Department of Commerce.
Existing Home Sales. These data are issued monthly by the National Association of Realtors, and capture the number of existing homes that were sold in the previous month.
High-End Home Sales. This series represents sales of new homes priced at $750,000 and over. The data are released quarterly by the U.S. Department of Commerce, and are not seasonally adjusted. Thus a valid comparison is made to the same quarter of prior year.
Mortgage Rate. We have chosen the rate on 30-year conventional loans that is issued by the Federal Home Loan Mortgage Corporation (known popularly as Freddie Mac.) Although there are a large number of mortgage instruments available to consumers, this one is still the most commonly used.
Employees in Residential Remodeling. This indicator denotes the number of individuals employed in construction firms that do mostly residential remodeling work.
Building Materials Sales. These data, released monthly by the Department of Commerce, capture the total sales of building materials, regardless of whether consumers or contractors purchased them. However, we should caution that the data also include sales to projects other than residential houses.
Appliance Store Sales. This driver captures the monthly sales of stores that sell mostly household appliances; the data are stated at an annual rate. We should not confuse this driver with total appliance sales, since they are sold by other types of stores such as Home Centers.
We hope that you find this dashboard useful as a general guide to the state of our industry. Please contact us if you would like to see further detail.


