

February’s employment data brought the good news that 235,000 jobs were added for the month. This is virtually identical to January, when 238,000 jobs were created.
We also learned that remodeling firms added 5,200 employees in January (remodeling employment data are always released one month behind). This is the strongest expansion our industry has seen in nearly five years.
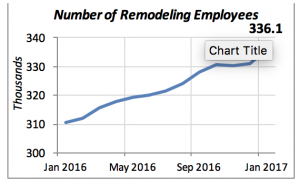
Employment in the remodeling industry reached 336,100 workers; the highest number of workers since the Department of Labor started collecting the data back in 1990.
But average wages fell to $21.61 per hour, 71 cents per hour less than the all-time peak of $22.32 reached last September. The decline does not necessarily mean that workers are getting paid less, but it is likely the result of less skilled workers being hired.
When the economy contracts, as happened during the last recession in 2008-09, businesses are forced to lay off workers. Typically, they will get rid of the less skilled workers, since skilled workers are more difficult to find and perform jobs that require training. By keeping the more skilled workers, average wages remain higher.
Consumers’ views on the economy remain strong. The Index of Consumer Sentiment rose modestly in January to 98.5, maintaining the gains seen since the November election. Recent employment growth and the future prospects for both employment and the economy are giving consumers a more positive view of the U.S. economy.
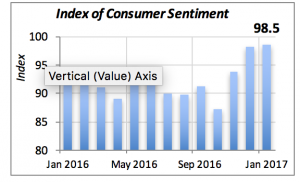
Note that, in the chart above, consumer sentiment had been relatively flat, if not declining, for most of last year. Other surveys of consumers also indicated that most felt the U.S. economy was on the wrong track until recently. It is still to be determined whether the change in tack will materialize in an improvement in consumers’ well-being.
We had enjoyed the benefits of slowly declining mortgage rates for several weeks, but they reversed direction last week. The 30-year mortgage rate rose to 4.21 percent last week. The bright employment data mentioned above, combined with other favorable news such as the gains in the stock market, will likely result in the Fed increasing interest rates.
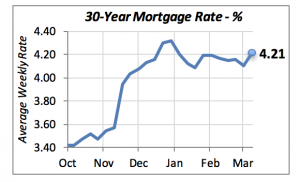
But we should be ready in case these increases in interest rates, and likely mortgage rates, put a damper on the residential construction markets. There will be an immediate effect on new residential construction, since house construction and purchasing depend heavily on interest rates.
Manuel Gutierrez, Consulting Economist to NKBA
Explanation of NKBA’s Economic Indicators Dashboard
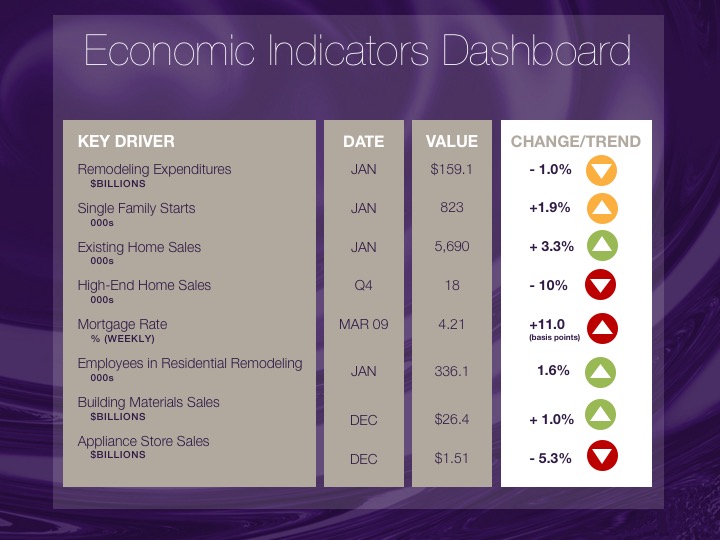
The dashboard displays the latest value of each economic indicator. Note that all the data, except for “mortgage rate” and “appliance store sales” are seasonally adjusted and are represented at annual rates.
Remodeling Expenditures. This is the amount of money spent on home improvement projects during the month in question. It covers all work done for privately-owned homes (excludes rentals, etc.). The data are in billions of dollars and are issued monthly by the U.S. Department of Commerce.
Single Family Starts. It is the number of single family houses for which construction was started in the given month. The data are in thousands of houses and are issued monthly by the U.S. Department of Commerce.
Existing Home Sales. These data are issued monthly by the National Association of Realtors, and capture the number of existing homes that were sold in the previous month.
High-End Home Sales. This series represents sales of new homes priced at $750,000 and over. The data are released quarterly by the U.S. Department of Commerce, and are not seasonally adjusted. Thus a valid comparison is made to the same quarter of prior year.
Mortgage Rate. We have chosen the rate on 30-year conventional loans that is issued by the Federal Home Loan Mortgage Corporation (known popularly as Freddie Mac.) Although there are a large number of mortgage instruments available to consumers, this one is still the most commonly used.
Employees in Residential Remodeling. This indicator denotes the number of individuals employed in construction firms that do mostly residential remodeling work.
Building Materials Sales. These data, released monthly by the Department of Commerce, capture the total sales of building materials, regardless of whether consumers or contractors purchased them. However, we should caution that the data also include sales to projects other than residential houses.
Appliance Store Sales. This driver captures the monthly sales of stores that sell mostly household appliances; the data are stated at an annual rate. We should not confuse this driver with total appliance sales, since they are sold by other types of stores such as Home Centers.
We hope that you find this dashboard useful as a general guide to the state of our industry. Please contact us if you would like to see further detail.


