

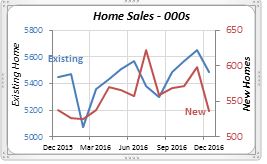
New Home Sales fell by 10% to an annual rate of 536 thousand homes in December. Existing Homes fell by a more modest 2.8% to a 5.49 million rate. Despite these declines, sales in December were above prior year levels. Sales for existing homes were 6% higher compared to the three months ending in December 2015; and 28% higher for new homes. So in both cases sales activity has been improving.
High-priced new homes, those sold for half a million dollars or more, also fell by 10% in December to a total of 18 thousand sold in the fourth quarter. For the year, high-end homes reached a total of 89 thousand sold, up 17% from 2015. Coincidentally, last year’s high-end new homes accounted for 17% of all new homes sold. This is the highest share they’ve taken since 2002. High-end home sales have increased significantly since the economic recession, when they accounted for only 8% of all new homes sold.
Last week the fourth quarter GDP growth data was released. At 1.6% for the fourth quarter of last year, that is the lowest growth rate since 2011. Although the GDP data will be revised over the next two quarters, it’s unlikely to bring 2016 growth to a level above that of the preceding two years.
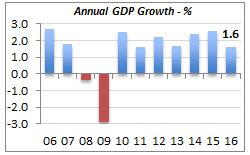
GDP is the presumed value of all goods and services provided by the economy in a year; it’s also the most comprehensive measurement of a nation’s economic activity. GDP growth over the last 11 years has averaged well below two percent as illustrated in the above chart. This average is brought down by the sharp decline in 2009 as well as the modest fall the prior year.
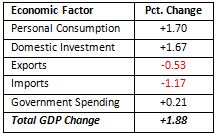
Exports of American goods and services and imports of foreign goods and services had the most negative impact on fourth quarter GDP growth. The table below shows the contribution in percentage points of the major components to the fourth quarter GDP growth.
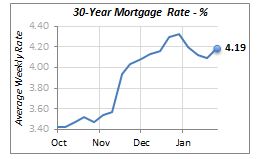
Another factor driving some sectors of our businesses, mortgage rates, reversed course last week. After consecutive declines for the first three weeks of this year, the 30-year fixed mortgage rate rose eight basis points to 4.19%. We expect they will continue to rise, particularly in light of the Fed’s policy to impose two or more interest rate increases this year.
If the US economy revives from the slow growth pace maintained since the turn of the century, we may see demand pressures driving mortgage rates higher.
Manuel Gutierrez, Consulting Economist to NKBA
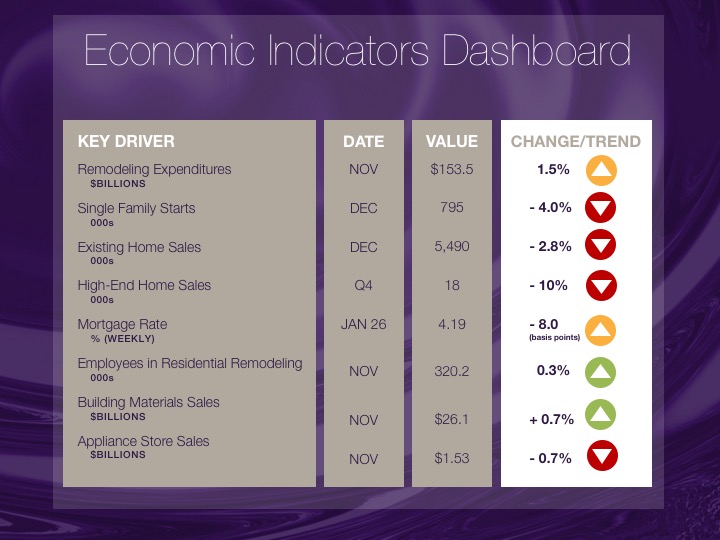
Explanation of NKBA’s Economic Indicators Dashboard
The dashboard displays the latest value of each economic indicator. Note that all the data, except for “mortgage rate” and “appliance store sales” is seasonally adjusted and is represented at annual rates.
Remodeling Expenditures. This is the amount of money spent on home improvement projects during the month in question. It covers all work done for privately-owned homes (excludes rentals, etc.). The data is in billions of dollars and is issued monthly by the U.S. Department of Commerce.
Single Family Starts. It is the number of single family houses for which construction was started in the given month. The data is in thousands of houses and is issued monthly by the U.S. Department of Commerce.
Existing Home Sales. This data is issued monthly by the National Association of Realtors, and captures the number of existing homes that were sold in the previous month.
High-End Home Sales. This series represents sales of new homes priced at $750,000 and over. The data is released quarterly by the U.S. Department of Commerce, and is not seasonally adjusted. Thus a valid comparison is made to the same quarter of prior year.
Mortgage Rate. We have chosen the rate on 30-year conventional loans that is issued by the Federal Home Loan Mortgage Corporation (known popularly as Freddie Mac.) Although there are a large number of mortgage instruments available to consumers, this one is still the most commonly used.
Employees in Residential Remodeling. This indicator denotes the number of individuals employed in construction firms that do mostly residential remodeling work.
Building Materials Sales. This data, released monthly by the Department of Commerce, captures the total sales of building materials, regardless of whether consumers or contractors purchased them. However, we should caution that the data also includes sales to projects other than residential houses.
Appliance Store Sales. This driver captures the monthly sales of stores that sell mostly household appliances; the data is stated at an annual rate. We should not confuse this driver with total appliance sales, since they are sold by other types of stores such as Home Centers, for instance.
We hope that you find this dashboard useful as a general guide to the state of our industry. Please contact us if you would like to see further detail.


