
GDP Growth Falters on Revision
The Department of Commerce, through its Bureau of Economic Analysis, releases the Gross Domestic Product data on a quarterly basis, usually at the end of the month following a quarter’s end. Thus, at the end of April, it releases first-quarter data; at the end of July, the second-quarter data, etc.
But it also revises the data on the following two quarters after the first release; that is, second-quarter data is initially released in July, and subsequently revised both at the end of August and September.
The first revision of second-quarter data came out last week. Initially, GDP 2Q growth was stated at 2.1% but it has been lowered, in the latest update, to 2%.
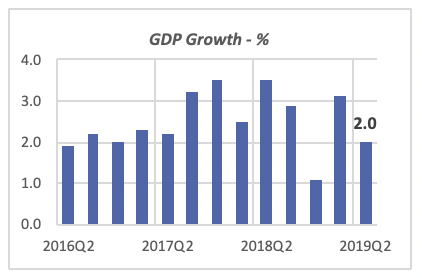
Second-quarter growth was a deceleration from the first quarter, when growth is estimated at 3.1%. Also, as can be ascertained from the data in the chart above, growth is lower than the average of the previous eight quarters, which was 2.8%.
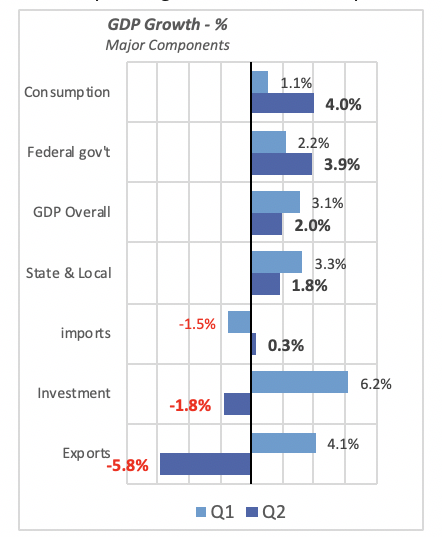
Among the major components of GDP, the largest contributors were consumer spending, up 4%, and non-defense government spending, which rose 3.9%. The chart below displays first- and second-quarter growth for these components.
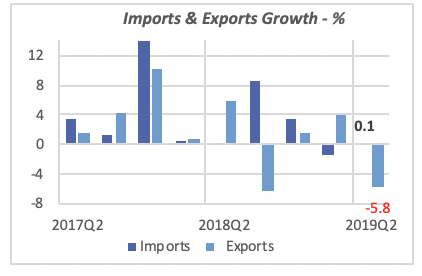
The Administration’s trade discussions and the lack of a clear resolution on tariffs (primarily with China) are having an impact in both U.S. imports and exports. Imports rose by a negligible 0.1% in the second quarter, far below the average of nearly 4% seen over the preceding three years.
And exports actually fell by a substantial 5.8%, in contrast to the nearly 4% quarterly average growth of the previous three years.
Consumer Confidence Drops on Tariff Concerns
The trade disputes are having an impact on consumers’ opinions as well, although they have not yet translated into changes in purchasing behavior.
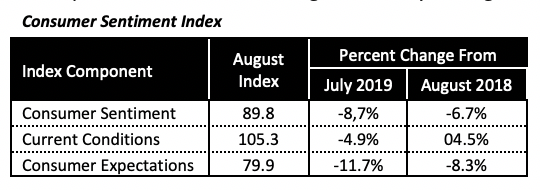
The latest consumer opinion survey, done by the University of Michigan, revealed that the Consumer Sentiment Index fell by 8.6 points in August to 89.8. This is the largest decline in nearly seven years; the sentiment index fell by 9.8 points in December 2012.
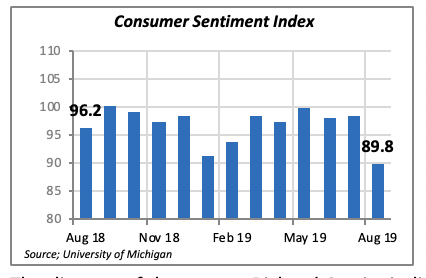
The director of the survey, Richard Curtin, indicated that a third of consumers who responded to the survey mentioned tariffs (voluntarily) as a current concern. Clearly, the continued changes in the dispute with China are causing uncertainty among consumers.
Unemployment Claims at 50-Year Low
Aside from the daily stock market prices there are very few statistics that reflect actual economic events. The vast majority of economic data, such as GDP or housing starts data, for instance, are based on surveys that reflect estimates of actual data.
But one notable exception is the weekly report on claims for unemployment, claims that are made by actual workers when they are laid off or fired from their jobs. The unemployment claims data are actual, not estimated, and are available and released on a timely basis. For instance, the latest data available are from the week ending on Aug. 19, just two weeks ago.
The latest number of 215,000 persons submitting a claim for unemployment is a historical low. One has to go back to the late 1960s — more than 50 years ago — to find an equivalently low number. In fact, claims reported Dec. 20, 1969, were 214,000 — just 500 lower than the latest report.
The chart below displays claims from the beginning of the 21stcentury, illustrating that today’s claims are by far the lowest of the last 20 years by nearly 100,000 workers.
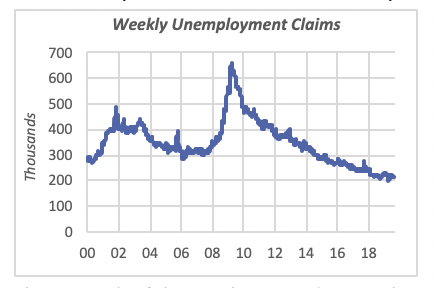
The strength of the employment data can be seen when comparing the number of workers laid-off/fired to the total number of workers. Employment in the late Sixties was around 71 million workers, less than half the current employment of 151 million people. Yet, the number of claims in both periods is at the same level: around 215,000.
The claims data also tells us that, despite current economic uncertainties, businesses are holding on to workers. One obvious reason lies in the difficulty of finding workers to fill positions, given the low unemployment rate.
A second reason is that, even if business starts to weaken, it is very costly for a business to go through the firing/hiring process. If a business lays off workers and business picks up, it is very expensive and time consuming to find/hire/train a new worker. So, it is less costly to hang on to current workers even in adverse conditions.
Manufacturing Shipments Slip
Manufacturing shipments of durable goods, that is, products that are not consumed immediately or within a short period of time (such as food), fell in July by 1.1% to $254 billion. July’s drop cancels the previous month’s gain, when shipments had risen to $257 billion, a 1% increase.
Year-to-date through July, manufacturing shipments of durable goods reached $1.77 trillion, which is 3.2% higher than in same period last year. Shipments of virtually all major durable categories are up, with the only exception being non-defense aircraft and parts, which is running 10.2% below last year. It’s safe to conclude that the safety troubles surrounding the Boeing 737-Max planes, which have resulted in grounding those airplanes, has also resulted in a delay in shipments.
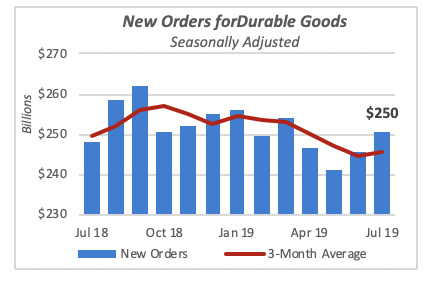
New orders rose 2.1% in July to $250.4 billion. This follows a nearly equal increase in June, up 1.8% to $245.3 billion. But year-to-date, orders are weaker, only 0.3% higher than they were in the January-to-July period last year.
In contrast to shipments, where most categories increased, new orders in several product categories fell in July, most noticeably non-defense aircraft and parts, with year-to-date orders of $61.4 billion, down a disappointing 35% from last year.
Mortgage Rates Edge Slightly Upward
Last week the 30-year, fixed mortgage rate rose a nearly negligible three basis points (0.03%) to 3.58%. But they are still at almost historical lows and, as previously pointed out, they are more than a percentage point lower than they were nine months ago, in November 2018.
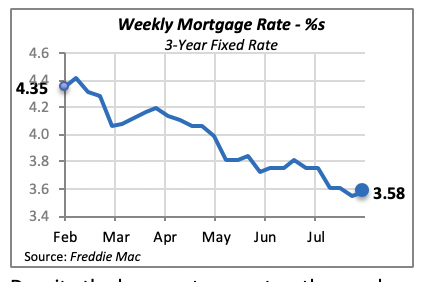
Despite the low mortgage rates, the number of mortgage applications declined more than 6% last week, as applications for home purchases as well as remodeling projects fell. The weakness of the market is attributed to low inventory of existing homes for sale, although this does not explain why new home construction remains week.
Manuel Gutierrez, Consulting Economist to NKBA
Explanation of NKBA’s Economic Indicators Dashboard
The dashboard displays the latest value of each economic indicator with a colored triangle that highlights visually the recent trend for each of the drivers. “Green” is a positive signal, indicating that the latest value is improving; “Yellow,” as it’s commonly understood, denotes caution because the variable may be changing direction; “Red” indicates that the variable in question is declining, both in its current value and in relation to the recent past.
Note that all the data, except for “mortgage rate” and “appliance-store sales” are seasonally adjusted and are represented at annual rates.
Remodeling Expenditures. This is the amount of money spent on home improvement projects during the month in question. It covers all work done for privately owned homes (excludes rentals, etc.). The data are in billions of dollars and are issued monthly by the U.S. Department of Commerce.
Single-Family Starts. This is the number of single-family houses for which construction was started in the given month. The data are in thousands of houses and are issued monthly by the U.S. Department of Commerce.
Existing-Home Sales. These data are issued monthly by the National Association of Realtors and capture the number of existing homes that were sold in the previous month.
High-End Home Sales. This series are sales of new homes priced at $500,000 and higher. The data are released quarterly by the U.S. Department of Commerce and are not seasonally adjusted. Thus, a valid comparison is made to the same quarter of prior year.
Mortgage Rate. We have chosen the rate on 30-year conventional loans that is issued by the Federal Home Loan Mortgage Corporation (known popularly as Freddie Mac.) Although there are a large number of mortgage instruments available to consumers, this one is still the most commonly used.
Employees in Residential Remodeling. This indicator denotes the number of individuals employed in construction firms that do mostly residential remodeling work.
Building-Materials Sales. These data, released monthly by the Department of Commerce, capture total sales of building materials, regardless of whether consumers or contractors purchased them. However, we should caution that the data also includes sales to projects other than residential houses.
Appliance-Store Sales.This driver captures the monthly sales of stores that sell mostly household appliances; the data are stated at an annual rate. We should not confuse this driver with total appliance sales, since they are sold by other types of stores such as home centers.
We hope you find this dashboard useful as a general guide to the state of our industry. Please contact us at Feedback@nkba.orgif you would like to see further detail.


