

Housing Starts Slip
Home remodelers honestly can’t expect much business growth to originate from the new housing sector. The headlines about last week’s starts were modestly unfavorable, with total housing starts falling under 1% to an annual rate of 1.25 million units. However, they remain a robust 6% ahead of June last year.
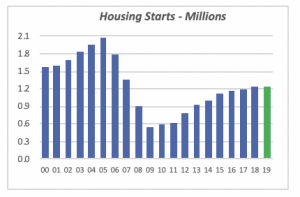
Despite the monthly fluctuations, housing starts have not shown any real improvement over the last 12 months, as seen in the chart below. Although starts last month reflect an improvement over their low level in February, they have not exceeded the 1.25 million unit rate for more than a decade. Most economists state that the correct rate of housing construction is closer to 1.5 million homes annually.
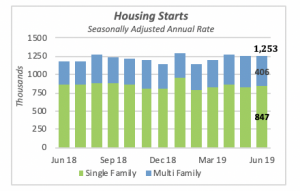
Single-family housing starts rose to an annualized rate of 847,000 units in June, up 3.5% from the previous month, but in contrast to total starts, they were slightly lower than the pace of 854,000 units in June 2018.
Multifamily housing starts, which are more volatile and tend to fluctuate sharply from month to month, came in last month at a rate of 406,000 units, which is 9% lower than the previous month. But in a pattern common to multifamily activity, they are 25% higher than June of last year, when builders started construction of multifamily units at an annualized pace of 326,000 units.
In contrast to prior recoveries, when housing starts would quickly bounce back to pre-recession levels, this has not been the case in the current cycle. Housing starts seem to have plateaued at around 1.25 million units (annualized), and there are no signs that things will improve in the near future.
For this year, the rate of housing for the first six months suggests that starts might even end up falling short of last year’s levels.
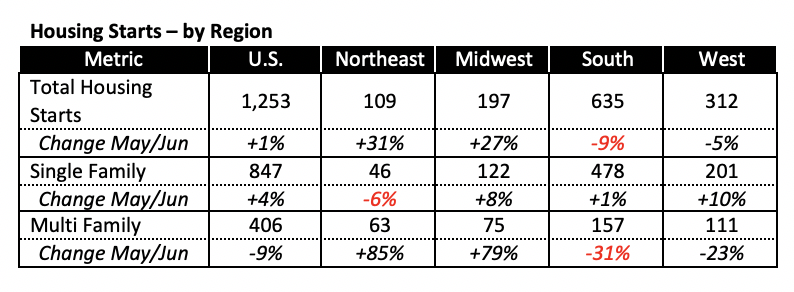
Regionally, housing starts in June were higher in three of the four regions. The exception was the South, which accounts for more than half of new housing construction, and where total starts were 9% lower than the prior month. But this drop was due to a drop in the South’s multi-family construction, which fell by 31% in June.
Retail Sales Maintain Minor Uptick for Month
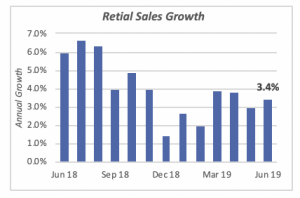
Total retail sales in June rose by 0.4%, an increase identical to that of the preceding two months. But compared to June of last year, retail sales are 3.4% higher. Although an improvement over the previous month, the increase in retail sales is not as robust as a year ago, when retail sales were increasing at a rate of 6% annually.
Total retail sales for June were $520 billion; year-to-date, they stand at $3.08 trillion. Compared to year-to-date 2018, sales are 3.1% higher.
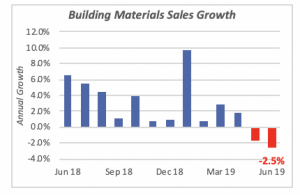
Sales of building materials also rose by 0.4% for the month, to $31.2 billion. But despite this increase, sales for the category in June were 2.5% lower than last year. In fact, as can be seen in the chart below, sales for the last two months have trailed the corresponding months a year ago. This is not surprising, given the relatively weak level of housing construction and remodeling.
Mortgage Rates Edge Up
Mortgage rates moved up modestly last week, to 3.81% — up six basis points from the previous week. This increase comes in the same week that the Fed appears to be ready to lower the Federal Reserve Funds rate by a quarter point or so.
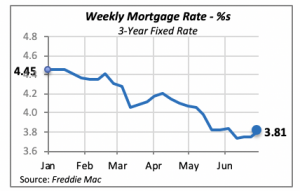
A quarter-point drop in the Fed Funds rate may or may not influence mortgage rates. Nonetheless, economists don’t expect much improvement in housing construction from a further fall in interest rate. The mortgage rate has dropped more than a percentage point over the last eight months with no perceptible impact on new housing starts.
Manuel Gutierrez, Consulting Economist to NKBA
Explanation of NKBA’s Economic Indicators Dashboard
The dashboard displays the latest value of each economic indicator with a colored triangle that highlights visually the recent trend for each of the drivers. “Green” is a positive signal, indicating that the latest value is improving; “Yellow,” as it’s commonly understood, denotes caution because the variable may be changing direction; “Red” indicates that the variable in question is declining, both in its current value and in relation to the recent past.
Note that all the data, except for “mortgage rate” and “appliance-store sales” are seasonally adjusted and are represented at annual rates.
Remodeling Expenditures. This is the amount of money spent on home improvement projects during the month in question. It covers all work done for privately owned homes (excludes rentals, etc.). The data are in billions of dollars and are issued monthly by the U.S. Department of Commerce.
Single-Family Starts. This is the number of single-family houses for which construction was started in the given month. The data are in thousands of houses and are issued monthly by the U.S. Department of Commerce.
Existing-Home Sales. These data are issued monthly by the National Association of Realtors and capture the number of existing homes that were sold in the previous month.
High-End Home Sales. This series are sales of new homes priced at $500,000 and higher. The data are released quarterly by the U.S. Department of Commerce and are not seasonally adjusted. Thus, a valid comparison is made to the same quarter of prior year.
Mortgage Rate. We have chosen the rate on 30-year conventional loans that is issued by the Federal Home Loan Mortgage Corporation (known popularly as Freddie Mac.) Although there are a large number of mortgage instruments available to consumers, this one is still the most commonly used.
Employees in Residential Remodeling. This indicator denotes the number of individuals employed in construction firms that do mostly residential remodeling work.
Building-Materials Sales. These data, released monthly by the Department of Commerce, capture total sales of building materials, regardless of whether consumers or contractors purchased them. However, we should caution that the data also includes sales to projects other than residential houses.
Appliance-Store Sales.This driver captures the monthly sales of stores that sell mostly household appliances; the data are stated at an annual rate. We should not confuse this driver with total appliance sales, since they are sold by other types of stores such as home centers.
We hope you find this dashboard useful as a general guide to the state of our industry. Please contact us at Feedback@nkba.orgif you would like to see further detail.


