

Housing Markets in Flux
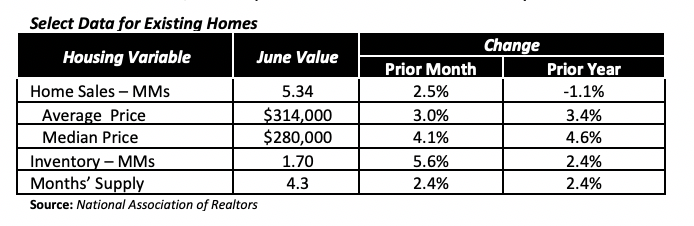
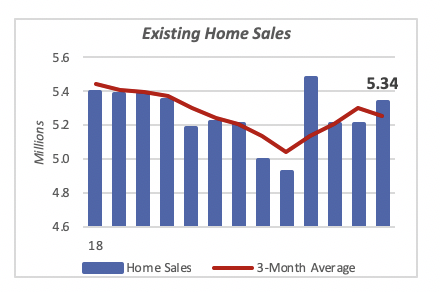
Two housing market statistics released last week sent conflicting signals, which seems to be a consistent pattern lately. On one hand, total housing starts fell in May to an annualized rate of nearly 1.3 million units, a modest decline of 0.9%. But, on the other hand, sales of existing homes increased by 2.5% to an annualized rate of about 5.3 million homes sold.
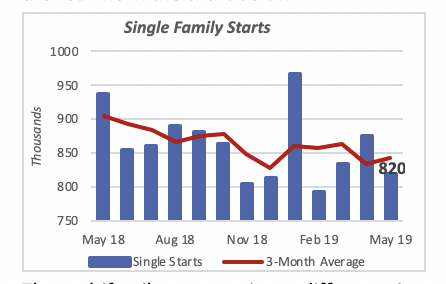
The modest decline in total housing starts is the result of a sharp 6.4% drop in single-family housing starts, which fell to a rate of 820,000 units, countered by a 10.9% rise in the construction of multifamily units.
Despite favorable mortgage rates and a tight supply of existing homes for sale, construction of single-family houses, which is an alternative to buying an existing home, remains relatively stagnant. Construction of single-family homes has ranged between 800,000 and 900,000 units annually over the last three years, with no clear sign of breaking out of that band. Further, the trend in single-family construction has been slightly negative over the last year, as illustrated by the red line in the chart below.
The multifamily sector paints a different picture. Starts for multifamily houses rose 10.9% in May, to reach a rate of 449,000 units. This is the fourth month of gains in multifamily construction.
The vast majority of multifamily housing is in buildings that have five or more units. On a typical month, more than 95% of these units are in buildings with five or more units, most of which are designed for rental purposes.
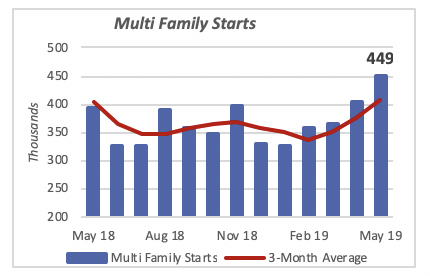
New homes built for condominium ownership, rather than as rental apartments, account for less than 10% of the multifamily units. This means many fewer condos are being built now than were being built 10 years ago, when nearly half of such units were sold as condominiums.
On the home sales averaged between 5 million and 5.4 million units (annualized) every month over the past year. Although low inventory of homes for sale is often mentioned as a deterrent for higher levels of activity, other factors, such as high prices, could be significant. In fact, as the table below shows, house prices rose 3.4% over the last year.
Retail Sales Rising
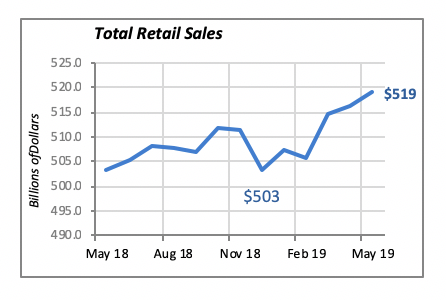
Retail sales have revived over the last four months, and they jumped 0.5% in May to $519 billion; sales are also more than 3% higher than they were a year ago (+3.2%). Except for a sharp 5.5% drop in January, when total retail sales fell to $503 billion, they have continued to rise more or less steadily over the last four months. January typically reflects softer sales after the holiday selling period.
Over the last 12 months, sales at restaurantslead with the largest increase, jumping 3.7% in the year ended in May. Health stores and general merchandise stores sales also increased significantly over last year, by 3.4% and 3.3%, respectively. These three types of outlets also had strong increases over the last month, but together they represent less than a quarter of total sales.
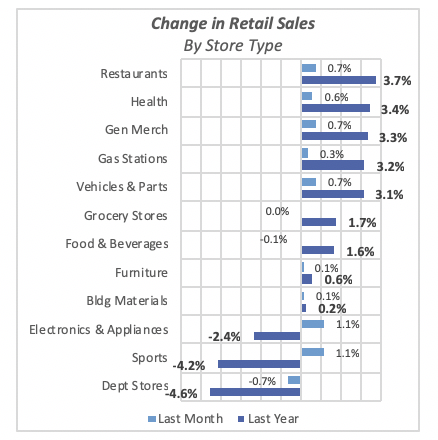
Sales at vehicles & partsstores, which account for 21% of total retail, rose by a respectable 3.1% over the last 12 months.
Mortgage Rates Inch Up
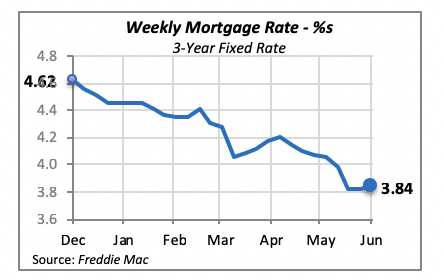
Even though the 30-year fixed mortgage rate moved up by two basis points last week (+0.02%) to 3.84%, the increase is not substantial as to impede households from borrowing funds to purchase a house. But, as evidenced by home-buying data, the drop of nearly 1% in mortgage rates over the last six months has not yet been sufficient to revive the housing markets. Other factors, such as the high levels of debt owed by many young households, hinder them from being able to afford to a home purchase.
Last week’s decision by the Federal Reserve Bank not to change its policy regarding monetary conditions implies that interest rates will not change in the near term owing to any Fed policy.
Manuel Gutierrez, Consulting Economist to NKBA
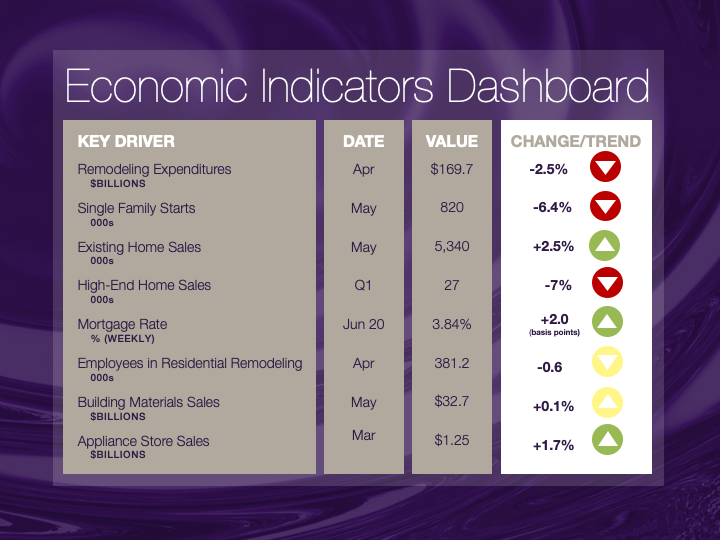
Explanation of NKBA’s Economic Indicators Dashboard
The dashboard displays the latest value of each economic indicator with a colored triangle that highlights visually the recent trend for each of the drivers. “Green” is a positive signal, indicating that the latest value is improving; “Yellow,” as it’s commonly understood, denotes caution because the variable may be changing direction; “Red” indicates that the variable in question is declining, both in its current value and in relation to the recent past.
Note that all the data, except for “mortgage rate” and “appliance-store sales” are seasonally adjusted and are represented at annual rates.
Remodeling Expenditures. This is the amount of money spent on home improvement projects during the month in question. It covers all work done for privately owned homes (excludes rentals, etc.). The data are in billions of dollars and are issued monthly by the U.S. Department of Commerce.
Single-Family Starts. This is the number of single-family houses for which construction was started in the given month. The data are in thousands of houses and are issued monthly by the U.S. Department of Commerce.
Existing-Home Sales. These data are issued monthly by the National Association of Realtors and capture the number of existing homes that were sold in the previous month.
High-End Home Sales. This series are sales of new homes priced at $500,000 and higher. The data are released quarterly by the U.S. Department of Commerce and are not seasonally adjusted. Thus, a valid comparison is made to the same quarter of prior year.
Mortgage Rate. We have chosen the rate on 30-year conventional loans that is issued by the Federal Home Loan Mortgage Corporation (known popularly as Freddie Mac.) Although there are a large number of mortgage instruments available to consumers, this one is still the most commonly used.
Employees in Residential Remodeling. This indicator denotes the number of individuals employed in construction firms that do mostly residential remodeling work.
Building-Materials Sales. These data, released monthly by the Department of Commerce, capture total sales of building materials, regardless of whether consumers or contractors purchased them. However, we should caution that the data also includes sales to projects other than residential houses.
Appliance-Store Sales.This driver captures the monthly sales of stores that sell mostly household appliances; the data are stated at an annual rate. We should not confuse this driver with total appliance sales, since they are sold by other types of stores such as home centers.
We hope you find this dashboard useful as a general guide to the state of our industry. Please contact us at Feedback@nkba.orgif you would like to see further detail.


