

A Housing Recovery?
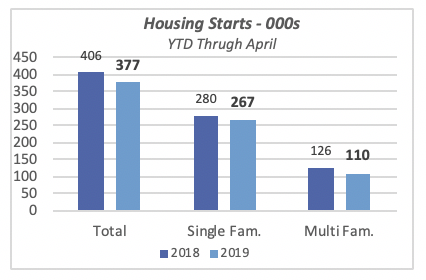
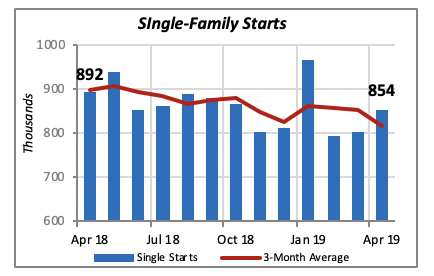
Even though housing starts have improved over the last couple of months, with the annual rate in April moving up to 854,000 units, the sector isn’t out of the woods yet. Note that year-to-date through April, 7% fewer housing units were started than in the comparable period of last year; that is, 377,000 houses have been started this year compared to 406,000 in the same stretch in 2018.
Construction of both single-family and multifamily units lag behind last year. Year-to-date single-family starts total 267,000 units, or 5% below the same period last year; and 13% fewer multifamily housing units have been started, for only 110,000 new units so far.
Further, the declining trend in single-family starts, depicted by the red line in the chart below, reveals the 3-month average was around 900,000 units (annualized rate) by April of last year, compared to just over 800,000 units this year.
Economists do not expect a stronger rebound in the near future, even though interest rates remain favorable, employment continues to grow and retail sales are robust, among other factors.
New Houses Are Getting Smaller
Businesses operating in the kitchen and bath industry are naturally interested that in addition to more houses being built, the houses are larger. Such was the case historically, when consumers were buying larger and larger houses. The only exceptions were periods of economic recession, for instance after the 2007-09 recession, when market forces discouraged consumers from purchasing large houses.
The chart below displays this trend over the last 30 years or so. Houses were getting larger year after year, increasing from 1,875 square feet in 1987 to the peak of 2,698 square feet by mid-2015. The typical new house built in 2015 was 823 square feet larger than its counterpart back in 1987.
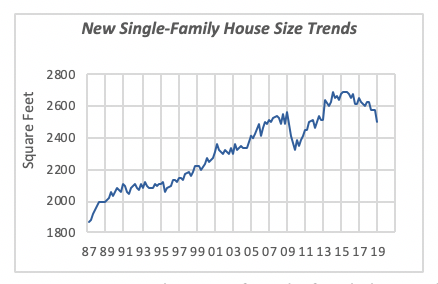
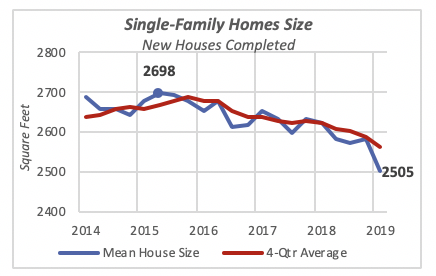
But since 2015, the size of single-family homes built has been declining, to an average of 2,505 square feet for single-family houses completed in the first quarter of this year. Homes built in the first quarter of this year are nearly 200 square feet smaller than they were just four years ago.
A similar phenomenon is occurring in the multifamily housing sector as well. The largest multifamily houses were built at the cusp of the housing boom earlier this century, when they reached 1,349 square feet in 2008. One factor driving the move toward larger multifamily units was condominiums: almost four in 10 of the housing units around that time were built for sale as condos, rather than for rent. Today, the proportion of units built for condominium projects is less than 10%.
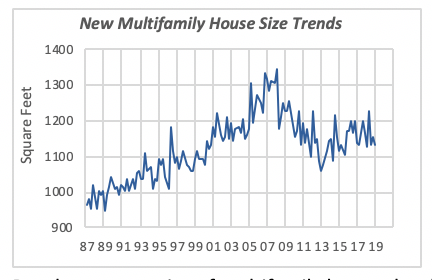
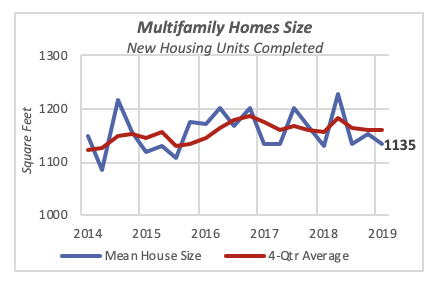
But the average size of multifamily houses has been relatively stable over the last few years. As can be seen in the chart below, the average has fluctuated between 1,100 and 1,200 square feet, with no discernible positive or negative trend.
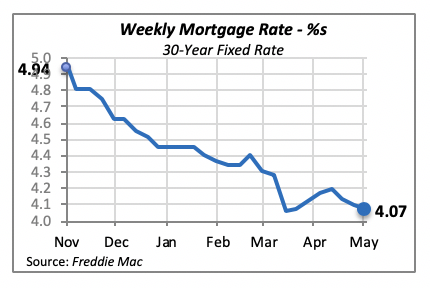
Mortgage Rates Slip Again
Mortgage rates fell again last week. Weak demand and the Fed’s neutral stance in not changing its policy suggest that further declines might be happening in the next few weeks. Although this is favorable toward the housing markets, it’s hard to tell whether further declines will revive the market, since so far, they do not appear to have had much of an impact.
Manuel Gutierrez, Consulting Economist to NKBA
Explanation of NKBA’s Economic Indicators Dashboard
The dashboard displays the latest value of each economic indicator with a colored triangle that highlights visually the recent trend for each of the drivers. “Green” is a positive signal, indicating that the latest value is improving; “Yellow,” as it’s commonly understood, denotes caution because the variable may be changing direction; “Red” indicates that the variable in question is declining, both in its current value and in relation to the recent past.
Note that all the data, except for “mortgage rate” and “appliance-store sales” are seasonally adjusted and are represented at annual rates.
Remodeling Expenditures. This is the amount of money spent on home improvement projects during the month in question. It covers all work done for privately owned homes (excludes rentals, etc.). The data are in billions of dollars and are issued monthly by the U.S. Department of Commerce.
Single-Family Starts. This is the number of single-family houses for which construction was started in the given month. The data are in thousands of houses and are issued monthly by the U.S. Department of Commerce.
Existing-Home Sales. These data are issued monthly by the National Association of Realtors and capture the number of existing homes that were sold in the previous month.
High-End Home Sales. This series are sales of new homes priced at $500,000 and higher. The data are released quarterly by the U.S. Department of Commerce and are not seasonally adjusted. Thus, a valid comparison is made to the same quarter of prior year.
Mortgage Rate. We have chosen the rate on 30-year conventional loans that is issued by the Federal Home Loan Mortgage Corporation (known popularly as Freddie Mac.) Although there are a large number of mortgage instruments available to consumers, this one is still the most commonly used.
Employees in Residential Remodeling. This indicator denotes the number of individuals employed in construction firms that do mostly residential remodeling work.
Building-Materials Sales. These data, released monthly by the Department of Commerce, capture total sales of building materials, regardless of whether consumers or contractors purchased them. However, we should caution that the data also includes sales to projects other than residential houses.
Appliance-Store Sales.This driver captures the monthly sales of stores that sell mostly household appliances; the data are stated at an annual rate. We should not confuse this driver with total appliance sales, since they are sold by other types of stores such as home centers.
We hope you find this dashboard useful as a general guide to the state of our industry. Please contact us at Feedback@nkba.org if you would like to see further detail.


