

Indications of a Rebound in Housing as Sales of New Homes Jump
Last week’s data revealed that February’s sales of existing homes soared by an unusually large 12% to an annual rate of 5.5 million houses sold. Also last week, the Department of Commerce released February’s sales of new homes, which rose nearly 5% for the month, to reach an annualized rate of 667,000 homes.
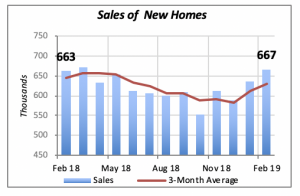
For all practical purposes, new home sales have been rising since October. The pace reached last month is the third-highest monthly rate since the onset of the recession more than 10 years ago. Does this mean that slump in home sales has been reversed? Unfortunately, statements on economic events are never final.
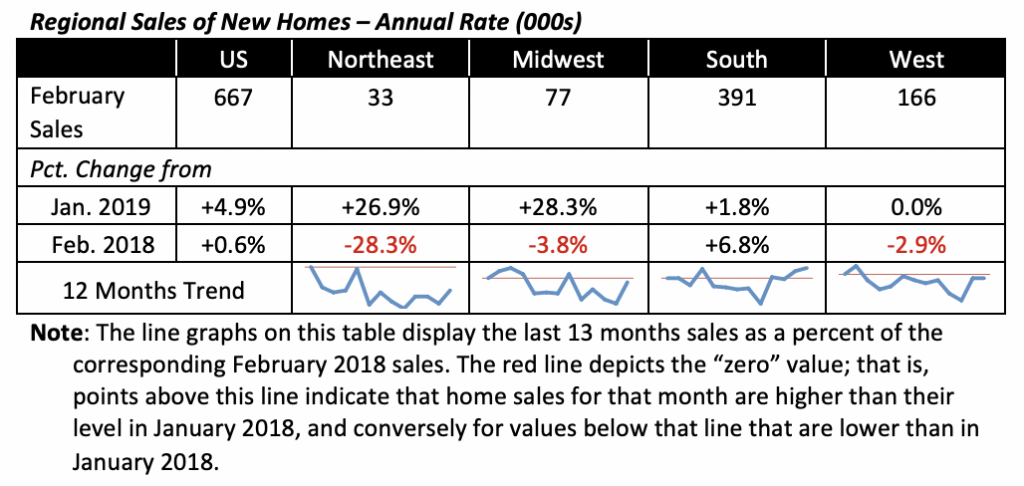
On a regional basis, sales of new homes increased or remained flat in each of the four zones, compared to Largest increases were in the Northeast (up by 27%) and the Midwest (+28%), while the South saw just under a 2% gain and sales were flat in the West.
But while news on home sales is favorable to remodeling businesses going forward —home sales generally lead to remodeling spending in the within a couple of years after the sale — the construction of new single family homes is not so favorable.
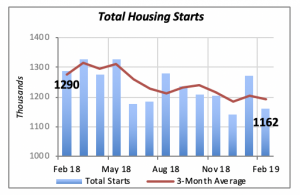
Housing starts in February fell by nearly 9% to an annualized rate of 1.16 million units — 110,000 fewer houses than the 1.27 million unit rate posted in January. But taking a longer perspective, as seen in the chart below, the January spike appears to be an anomaly on a clearly declining trend since the middle of last year.
More favorable mortgage rates should help the market, and perhaps enable more consumers to become homeowners.
The drop in total housing starts in February is attributable to single-family construction, which saw starts fall to an annualized rate of 805,000 units. The decrease in single-family construction follows the unusually high level of housing starts posted in January, when they reached a rate of 970,000 units. In fact, January’s pace was the highest in more than a decade — but again, this appears to be an aberration of the overall trend.
In contrast, construction of multifamily units rose 18% for the month to 357,000 (annualized).
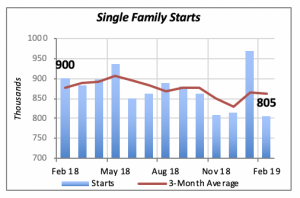
The chart above illustrates that February’s single-family starts fell to the level of the last two months of last year, when they averaged 811,00 units (annualized).
Interest Rates Keep Falling
Last week the 30-year fixed mortgage rate dropped by 22 basis points, that is, nearly one-quarter of 1%. This is their largest drop in recent history.
While the drop and lower mortgage rate should spark some life in the housing markets, it’s important to note that should note that declining mortgage rates also suggest lower demand for mortgage funds. Similar to any product where weak demand typically brings prices down, lower demand for mortgage funds or mortgage financing resulting from weak housing demand relieves pressure on loanable funds.
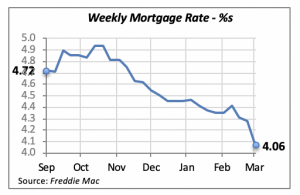
Nevertheless, declines in mortgage rates of this magnitude are very rare. In fact, in the 2,500 weeks since 1971, there are only 33 weeks when mortgage rates fell by more than 22 basis points, and most of them occurred during the economic recessions of 1988-1982 and 2008.
Manuel Gutierrez, Consulting Economist to NKBA
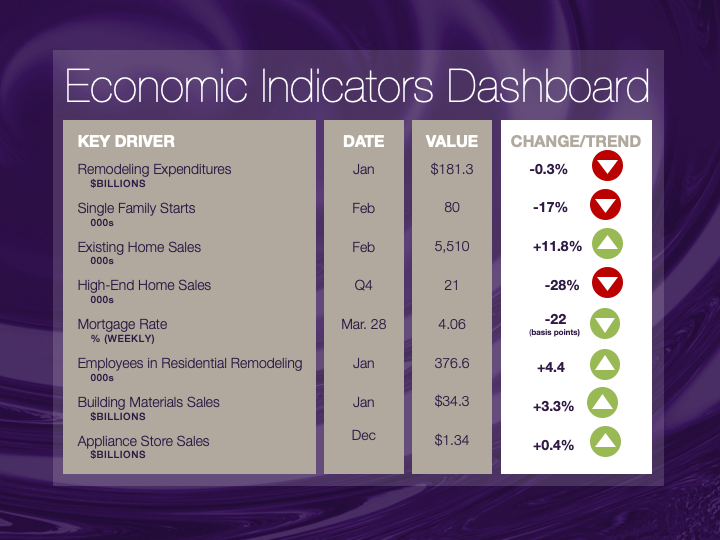
Explanation of NKBA’s Economic Indicators Dashboard
The dashboard displays the latest value of each economic indicator with a colored triangle that highlights visually the recent trend for each of the drivers. “Green” is a positive signal, indicating that the latest value is improving; “Yellow,” as it’s commonly understood, denotes caution because the variable may be changing direction; “Red” indicates that the variable in question is declining, both in its current value and in relation to the recent past.
Note that all the data, except for “mortgage rate” and “appliance-store sales” are seasonally adjusted and are represented at annual rates.
Remodeling Expenditures. This is the amount of money spent on home improvement projects during the month in question. It covers all work done for privately owned homes (excludes rentals, etc.). The data are in billions of dollars and are issued monthly by the U.S. Department of Commerce.
Single-Family Starts. This is the number of single-family houses for which construction was started in the given month. The data are in thousands of houses and are issued monthly by the U.S. Department of Commerce.
Existing-Home Sales. These data are issued monthly by the National Association of Realtors and capture the number of existing homes that were sold in the previous month.
High-End Home Sales. This series are sales of new homes priced at $500,000 and higher. The data are released quarterly by the U.S. Department of Commerce and are not seasonally adjusted. Thus, a valid comparison is made to the same quarter of prior year.
Mortgage Rate. We have chosen the rate on 30-year conventional loans that is issued by the Federal Home Loan Mortgage Corporation (known popularly as Freddie Mac.) Although there are a large number of mortgage instruments available to consumers, this one is still the most commonly used.
Employees in Residential Remodeling. This indicator denotes the number of individuals employed in construction firms that do mostly residential remodeling work.
Building-Materials Sales. These data, released monthly by the Department of Commerce, capture total sales of building materials, regardless of whether consumers or contractors purchased them. However, we should caution that the data also includes sales to projects other than residential houses.
Appliance-Store Sales.This driver captures the monthly sales of stores that sell mostly household appliances; the data are stated at an annual rate. We should not confuse this driver with total appliance sales, since they are sold by other types of stores such as home centers.
We hope you find this dashboard useful as a general guide to the state of our industry. Please contact us if you would like to see further detail.


