

Is U.S. Government Debt a Problem?
From time to time, some economists defend high government debt as beneficial to the American economy. Typically, those arguing in favor of increasing government spending are partisans to the party in power at the time they incur the additional debt. There are many who believe, however, that government spending is truly a benefit to the economy and, therefore, to consumers in general.
If this were the case, why does it appear that so many countries’ economies have been devastated by profligate government spending? There are many historical examples of nations that gradually decayed because of the extreme spending habits of their rulers. Greece is a current example of this disease that afflicts politicians — the disease of spending other people’s money. It is currently estimated that Greece’s public debt is twice its GDP. In other words, it would take two years of dedicating every euro earned in the economy to get rid of all the debt.
Italy facing a similar situation, except that its government debt is “only” one-and-a-half times its GDP. Because these two countries are members of the European Union, they rely on the beneficence of the Germans to keep them afloat.
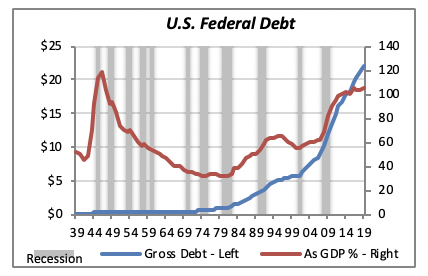
So where does the U.S. stand? Government debt has been roughly equal to GDP over the last few years, around 100% of GDP, although debt has exceeded GDP by 4% since 2016. But despite this high level of debt, the burden of interest payments has remained relatively low, thanks to the Fed’s “zero interest” policy followed over the last 10 years or so.
This central bank policy allows the government to borrow money at low rates. The result is that the $22 trillion of Federal debt will cost the government $369 billion in interest payments this year. Interest payments currently represent just over 8% of total Federal government outlays, which will total $4.4 trillion in 2019. This is approximately the same share it was from the mid-1950s to 1980, even though it has increased over the last four years.
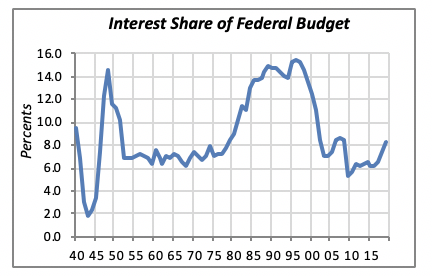
When the Fed moves to raise interest rates higher, it’s inevitable that interest will capture a greater share of the Federal budget. The government will be forced to either lower expenditures in other areas or, more likely, increase taxes. This may occur soon or, at worst, by 2025, when the tax reform adopted in late 2017 expires.
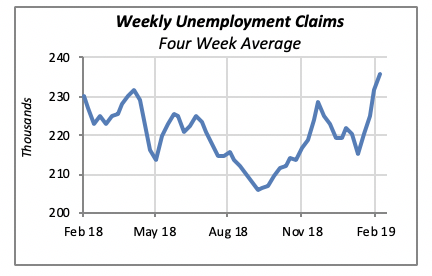
Unemployment Claims Rise
Unemployment claims edged up further last week, to a four-week average of 23,000. This is the average number of persons who filed for unemployment benefits over the previous four weeks. It is the highest level of claims in more than a year, although on a historical basis, weekly claims are still low. But even though the level remains below the long-term average of 353,000 weekly claims, we can’t ignore the fact that it has increased for three consecutive weeks.
Existing Home Sales Continue Slide
And sales of existing home fell yet further last month, to an annual rate of 4.94 million units. Although the month-to-month decline was relatively small, at 1.2%, it marks the third consecutive month of falling home sales. Compared to a year ago, January sales are lower by a more substantial 8.5%.
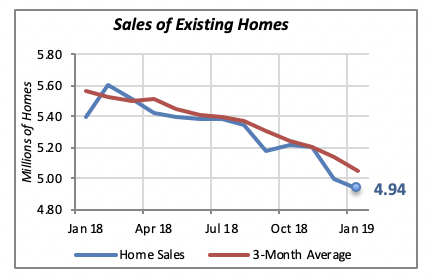
For all practical purposes, as can be gleaned from the chart above, home sales have been falling for a year now. However, it is expected that falling home prices may help reverse or at least stem the decline in sales.
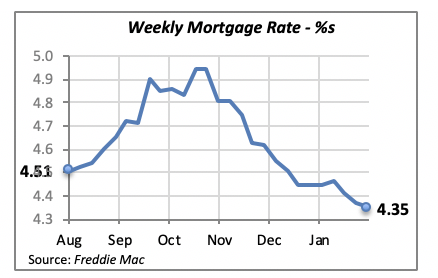
Mortgage Rates Also Continue Falling
In line with apparently weak demand for housing and the Fed suggesting a very cautious approach toward raising rates this year, mortgage rates keep falling — which could be the fertilizer that will revive the housing markets. Lower rates, combined with more affordable home prices, will entice potential consumers to take the plunge and purchase a home.
Manuel Gutierrez, Consulting Economist to NKBA
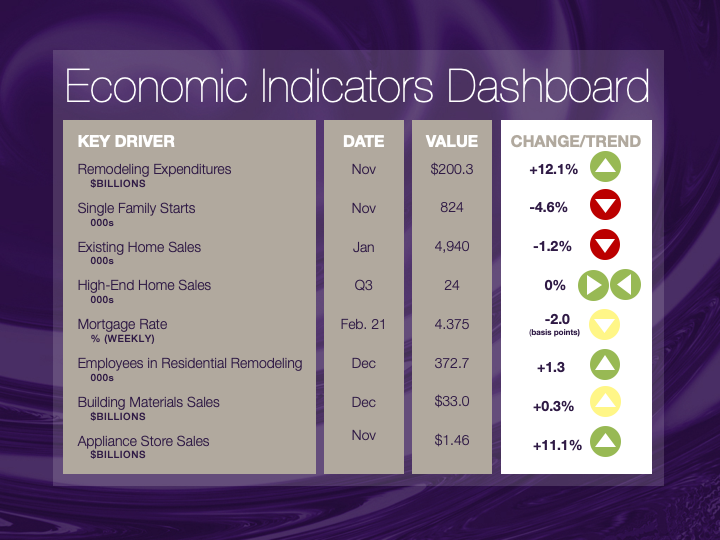
Explanation of NKBA’s Economic Indicators Dashboard
The dashboard displays the latest value of each economic indicator with a colored triangle that highlights visually the recent trend for each of the drivers. “Green” is a positive signal, indicating that the latest value is improving; “Yellow,” as it’s commonly understood, denotes caution because the variable may be changing direction; “Red” indicates that the variable in question is declining, both in its current value and in relation to the recent past.
Note that all the data, except for “mortgage rate” and “appliance-store sales” are seasonally adjusted and are represented at annual rates.
Remodeling Expenditures. This is the amount of money spent on home improvement projects during the month in question. It covers all work done for privately owned homes (excludes rentals, etc.). The data are in billions of dollars and are issued monthly by the U.S. Department of Commerce.
Single-Family Starts. This is the number of single-family houses for which construction was started in the given month. The data are in thousands of houses and are issued monthly by the U.S. Department of Commerce.
Existing-Home Sales. These data are issued monthly by the National Association of Realtors and capture the number of existing homes that were sold in the previous month.
High-End Home Sales. This series are sales of new homes priced at $500,000 and higher. The data are released quarterly by the U.S. Department of Commerce and are not seasonally adjusted. Thus, a valid comparison is made to the same quarter of prior year.
Mortgage Rate. We have chosen the rate on 30-year conventional loans that is issued by the Federal Home Loan Mortgage Corporation (known popularly as Freddie Mac.) Although there are a large number of mortgage instruments available to consumers, this one is still the most commonly used.
Employees in Residential Remodeling. This indicator denotes the number of individuals employed in construction firms that do mostly residential remodeling work.
Building-Materials Sales. These data, released monthly by the Department of Commerce, capture total sales of building materials, regardless of whether consumers or contractors purchased them. However, we should caution that the data also includes sales to projects other than residential houses.
Appliance-Store Sales.This driver captures the monthly sales of stores that sell mostly household appliances; the data are stated at an annual rate. We should not confuse this driver with total appliance sales, since they are sold by other types of stores such as home centers.
We hope you find this dashboard useful as a general guide to the state of our industry. Please contact us if you would like to see further detail.


