

Job Growth Still Rises as Pace Slows
Employment growth eased up somewhat in November from the previous month’s pace to 155,000 new jobs created. Although slightly less than expected, it’s not unusual for the number of jobs created to fluctuate from month to month. In fact, as the chart below indicates, in four of the previous 12 months, in most months where the number of new jobs has hovered around 150,000, the following month saw a spike.
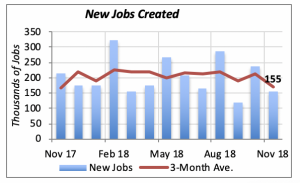
Over the 12 months ended in November, 2.44 million jobs have been created, which is an average of 203,000 a month. This number has been relatively stable over the past year, neither suggesting a positive nor negative trend. The red line in the chart above captures this pattern by the three-month moving average.
And, despite the wide fluctuations in the stock markets, employment growth is expected to continue to remain strong over the next year. This is especially true, now that it appears the Fed may be rethinking its intention to raise interest rates more aggressively.
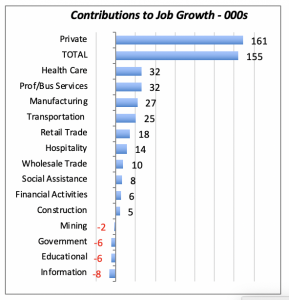
But what industries or sectors are driving this growth? Three in particular dominated job growth in November, as has been the case over the last year. Two of these industries, Health Care and Professional Business Services, lead with 32,000 added by each. Health Care has added 328,000 new jobs over the last 12 months, and Professional Business Services an even more robust 561,000 jobs. Manufacturing rounds up the three top industries, with an additional 27,000 jobs in November and 288,000 for the year.
These three industries represent half of the jobs added since November 2017.
The discrepancy between 161,000 jobs added in the private sector and 155,000 for the total is owing to the government losing 6,000 jobs.
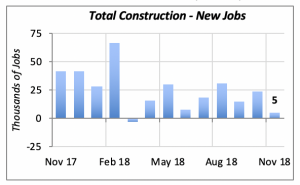
Closer to the businesses of NKBA members we find that Construction, a key industry, has grown at a slower pace the last few months. Only 5,000 construction jobs were added in November, far below the average of 24,000 new jobs added monthly since November 2017. This November’s increase of 7,000 jobs added in residential construction was offset by decreases in both non-residential construction and Specialty Trades categories.
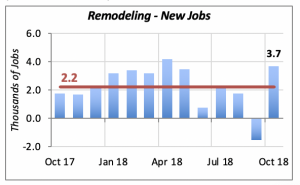
The remodeling sector, for which data are always released one month behind, shows 3,700 jobs added in October — a welcome rebound from the loss of 1,500 jobs the previous month. On average, remodeling businesses have hired an additional 2,200 workers a month for the last year, denoted by the red line in the chart below.
Respite for Mortgage Rates
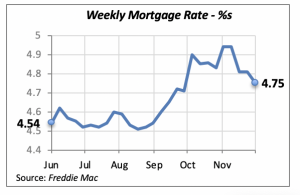
Mortgage rates eased further last week, dropping a modest six basis points to 4.75%. Uncertainty surrounding financial markets and weak demand for mortgage credit is partly responsible. Also, the Fed’s more recent apparent ambivalence for pushing interest rates higher has contributed to lower mortgage rates.
Manuel Gutierrez, Consulting Economist to NKBA
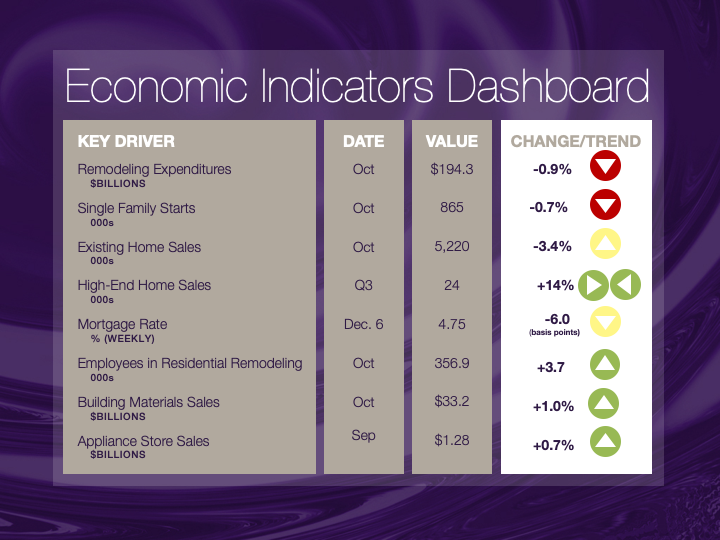
Explanation of NKBA’s Economic Indicators Dashboard
The dashboard displays the latest value of each economic indicator with a colored triangle that highlights visually the recent trend for each of the drivers. “Green” is a positive signal, indicating that the latest value is improving; “Yellow,” as it’s commonly understood, denotes caution because the variable may be changing direction; “Red” indicates that the variable in question is declining, both in its current value and in relation to the recent past.
Note that all the data, except for “mortgage rate” and “appliance-store sales” are seasonally adjusted and are represented at annual rates.
Remodeling Expenditures. This is the amount of money spent on home improvement projects during the month in question. It covers all work done for privately owned homes (excludes rentals, etc.). The data are in billions of dollars and are issued monthly by the U.S. Department of Commerce.
Single-Family Starts. This is the number of single-family houses for which construction was started in the given month. The data are in thousands of houses and are issued monthly by the U.S. Department of Commerce.
Existing-Home Sales. These data are issued monthly by the National Association of Realtors and capture the number of existing homes that were sold in the previous month.
High-End Home Sales. This series are sales of new homes priced at $500,000 and higher. The data are released quarterly by the U.S. Department of Commerce and are not seasonally adjusted. Thus, a valid comparison is made to the same quarter of prior year.
Mortgage Rate. We have chosen the rate on 30-year conventional loans that is issued by the Federal Home Loan Mortgage Corporation (known popularly as Freddie Mac.) Although there are a large number of mortgage instruments available to consumers, this one is still the most commonly used.
Employees in Residential Remodeling. This indicator denotes the number of individuals employed in construction firms that do mostly residential remodeling work.
Building-Materials Sales. These data, released monthly by the Department of Commerce, capture total sales of building materials, regardless of whether consumers or contractors purchased them. However, we should caution that the data also includes sales to projects other than residential houses.
Appliance-Store Sales.This driver captures the monthly sales of stores that sell mostly household appliances; the data are stated at an annual rate. We should not confuse this driver with total appliance sales, since they are sold by other types of stores such as home centers.
We hope you find this dashboard useful as a general guide to the state of our industry. Please contact us if you would like to see further detail.


