

Total Housing Starts Up Despite Single-Family Slip
Total housing starts rose last month by 2.2% to reach an annualized rate of 1.23 million units. Construction of new homes has been hovering at around 1.2 million units over the last few months, neither improving nor deteriorating.
The overall gain in total housing starts is the result of a robust increase in multifamily housing, which makes up for a reduction in the construction rate for single-family homes.
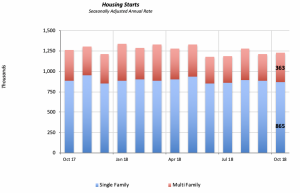
Construction of single-family houses fell by less than one percent (-0.7%) in October, to an annualized rate of 865,000 units. This pace of construction is on par with the average seen over the last five months, when single-family building has ranged between 850,000 and 800,000 units.
At the same time, construction of multifamily housing units jumped by 10% in October, to reach an annual rate of 363,000 units. It should be noted, however, that multifamily construction tends to be very volatile, fluctuating wildly from month to month. In fact, multifamily starts rose 20% in August only to be followed by a 15% drop in September. In fact, the fluctuations in multifamily housing construction are even sharper at the regional level, shown in the chart below:
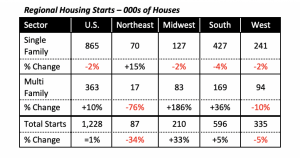
Single-family housing construction fell in three of the four regions. The largest decline was in the South which typically contributes around half of the new single-family housing.
But a big rebound in the South’s building of multi family units drove the positive result for U.S. multifamily construction.
All in all, with 10 months of data in so far this year, it is evident that housing construction will barely be just 5% above last year’s total of 1.2 million housing units.
U.S. Consumers Are Saving More
The percentage of disposable income that consumers are saving has risen modestly this year to 6.8%, up 0.1% from last year. Since its recovery around 2010, consumers have been saving at a rate comparable to what it was in the late Nineties.
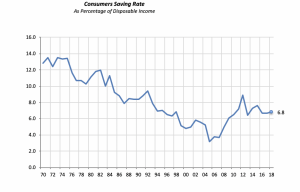
Furthermore, as the chart clearly shows, the last few years reversed the concerning steady decline in consumer savings throughout the last century.
Greater savings is generally good for an economy. A larger pool of savings means that more funds are available for investment in productive capacity by businesses. In addition, consumers have funds available for any unforeseen needs.
Still, it is not known whether the greater savings are simply the result of greater number of people reaching retirement age: the baby boomers. Older people tend to spend less on consumer goods; their needs for necessities — other than health care — may be less than those for younger people.
Thus, a higher savings rage could simply be a result of the nation’s changing demographics and not necessarily a change in consumer habits to more desirable outcomes.
Mortgage Rates Decline
On a positive note, last week the 30-year fixed mortgage rate fell by 13 basis points to 4.81% — its lowest level in six weeks.
This is good news for the industry, since lower rates make a purchasing or refinancing a home more affordable — even though one reason for the lower rates might be weak housing demand.
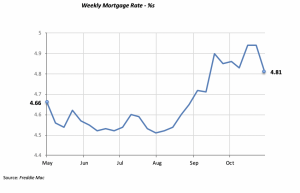
The recent decision by the Federal Reserve Bank not to increase the Fed Funds Rate two weeks ago also had a positive influence on mortgage rates. But, of course, it is not known what action, if any, the Fed may take the next time it meets.
Manuel Gutierrez, Consulting Economist to NKBA
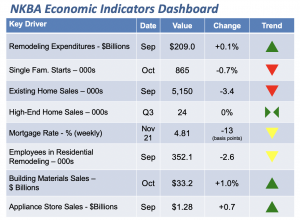
Explanation of NKBA’s Economic Indicators Dashboard
The dashboard displays the latest value of each economic indicator with a colored triangle that highlights visually the recent trend for each of the drivers. “Green” is a positive signal, indicating that the latest value is improving; “Yellow,” as it’s commonly understood, denotes caution because the variable may be changing direction; “Red” indicates that the variable in question is declining, both in its current value and in relation to the recent past.
Note that all the data, except for “mortgage rate” and “appliance-store sales” are seasonally adjusted and are represented at annual rates.
Remodeling Expenditures. This is the amount of money spent on home improvement projects during the month in question. It covers all work done for privately owned homes (excludes rentals, etc.). The data are in billions of dollars and are issued monthly by the U.S. Department of Commerce.
Single-Family Starts. This is the number of single-family houses for which construction was started in the given month. The data are in thousands of houses and are issued monthly by the U.S. Department of Commerce.
Existing-Home Sales. These data are issued monthly by the National Association of Realtors and capture the number of existing homes that were sold in the previous month.
High-End Home Sales. This series are sales of new homes priced at $500,000 and higher. The data are released quarterly by the U.S. Department of Commerce and are not seasonally adjusted. Thus, a valid comparison is made to the same quarter of prior year.
Mortgage Rate. We have chosen the rate on 30-year conventional loans that is issued by the Federal Home Loan Mortgage Corporation (known popularly as Freddie Mac.) Although there are a large number of mortgage instruments available to consumers, this one is still the most commonly used.
Employees in Residential Remodeling. This indicator denotes the number of individuals employed in construction firms that do mostly residential remodeling work.
Building-Materials Sales. These data, released monthly by the Department of Commerce, capture total sales of building materials, regardless of whether consumers or contractors purchased them. However, we should caution that the data also includes sales to projects other than residential houses.
Appliance-Store Sales.This driver captures the monthly sales of stores that sell mostly household appliances; the data are stated at an annual rate. We should not confuse this driver with total appliance sales, since they are sold by other types of stores such as home centers.
We hope you find this dashboard useful as a general guide to the state of our industry. Please contact us if you would like to see further detail.


