

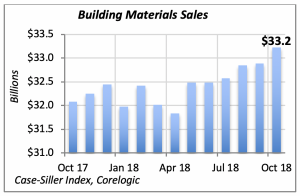
Sales of Building Materials Hit Record
Sales at building-materials stores shot up by 1% in October, to reach an all-time high of $33.2 billion for the month. Despite the weakness in new housing construction as well as home sales, building materials volume has increased in each of the last six months.
Last month’s sales increase in the category is slightly higher than the 0.8% increase in overall retail sales. In fact, only sales of “motor vehicles and parts” were stronger; the latter increased by 1.1% in October.
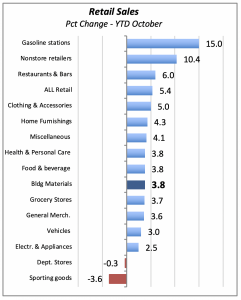
Year-to-date through October, sales at building materials stores reached $328 billion, up a robust 3.8% over the same period last year. However, as can be seen in the chart below, year-to-date they lag several other categories. Also, building materials sales through October are lower than total retail sales, which are up 5.4% over the last 10 months.
Remodeling Remains Steady
While new housing construction and home sales have softened over the last few months, the remodeling market remains strong. The rate of spending by homeowners in September was $209 billion — virtually the same as in the preceding two months.
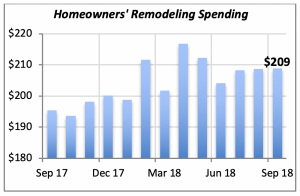
The story has changed from three months prior. The June rate showed that remodeling had fallen by nearly 6% over two months from April’s rate of spending, which clocked in at $216 billion.
At the same time, however, employment in remodeling businesses fell by 2,600 workers, or 0.7%. September’s drop in employment followed continuous gains in employment since April 2017.
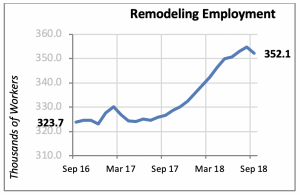
In fact, employment at remodeling firms has increased nearly 8% over the last 12 months. This improvement has been attained against lackluster home sales and an environment of slowly rising interest rates.
Mortgage Rates Stabilize — For Now
Perhaps aided by the Fed’s decision not to change interest rates two weeks ago, the 30-year fixed mortgage rate remained unchanged at 4.94% last week. This is welcome news after the sharp increase of 11 basis points the previous week.
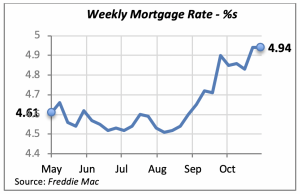
The Federal Funds Rate, influenced or controlled by the Federal Reserve Bank through its policies, has risen by 49 basis points since early May, hitting 2.19% last week. At the same time, the mortgage rate has risen by a more modest 33 points.
Manuel Gutierrez, Consulting Economist to NKBA
Explanation of NKBA’s Economic Indicators Dashboard
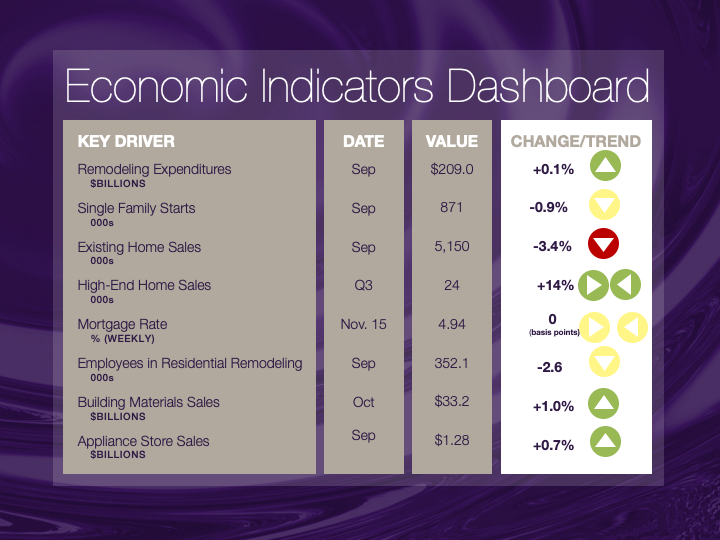
The dashboard displays the latest value of each economic indicator with a colored triangle that highlights visually the recent trend for each of the drivers. “Green” is a positive signal, indicating that the latest value is improving; “Yellow,” as it’s commonly understood, denotes caution because the variable may be changing direction; “Red” indicates that the variable in question is declining, both in its current value and in relation to the recent past.
Note that all the data, except for “mortgage rate” and “appliance-store sales” are seasonally adjusted and are represented at annual rates.
Remodeling Expenditures. This is the amount of money spent on home improvement projects during the month in question. It covers all work done for privately owned homes (excludes rentals, etc.). The data are in billions of dollars and are issued monthly by the U.S. Department of Commerce.
Single-Family Starts. This is the number of single-family houses for which construction was started in the given month. The data are in thousands of houses and are issued monthly by the U.S. Department of Commerce.
Existing-Home Sales. These data are issued monthly by the National Association of Realtors and capture the number of existing homes that were sold in the previous month.
High-End Home Sales. This series are sales of new homes priced at $500,000 and higher. The data are released quarterly by the U.S. Department of Commerce and are not seasonally adjusted. Thus, a valid comparison is made to the same quarter of prior year.
Mortgage Rate. We have chosen the rate on 30-year conventional loans that is issued by the Federal Home Loan Mortgage Corporation (known popularly as Freddie Mac.) Although there are a large number of mortgage instruments available to consumers, this one is still the most commonly used.
Employees in Residential Remodeling. This indicator denotes the number of individuals employed in construction firms that do mostly residential remodeling work.
Building-Materials Sales. These data, released monthly by the Department of Commerce, capture total sales of building materials, regardless of whether consumers or contractors purchased them. However, we should caution that the data also includes sales to projects other than residential houses.
Appliance-Store Sales.This driver captures the monthly sales of stores that sell mostly household appliances; the data are stated at an annual rate. We should not confuse this driver with total appliance sales, since they are sold by other types of stores such as home centers.
We hope you find this dashboard useful as a general guide to the state of our industry. Please contact us if you would like to see further detail.


