

Employment Continues To Increase
Like a different page of the same book, employment in the U.S. grew in September by another 134,000 workers, bringing the total number of employed people to 149.5 million. In addition to restoring the 8.7 million jobs lost during the recession of 2007-2009, the economy has added 11.1 million new jobs in the past decade.
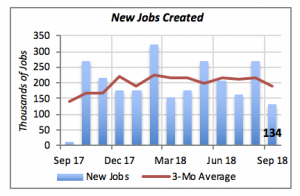
Although the 134,000 jobs added last month is the smallest gain in the last 12 months, the red line in the chart above indicates that the number of jobs added each month over the last year has averaged around 200,000.
Year-to-date through September, American employers have added 1.88 million jobs — just under 350,000 more than were created in the same period last year.
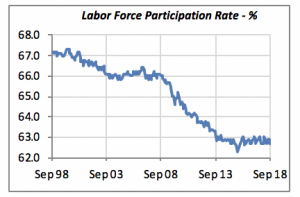
In other employment news, while the jobless rate fell to 3.7% in September, the participation rate remained at 62.7%. This rate reflects the percentage of the working-age population that is either working or actively seeking a job. But the participation rate has stabilized at around 63%, where it’s been for the last five years. It is not expected to recover to the rates seen 10 or 20 years ago because of the large number of baby boomers who are reaching retirement age, and are opting to quit the labor force rather than continue working.
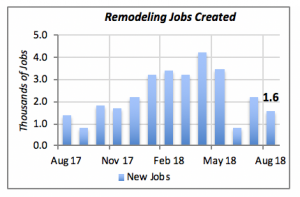
Closer to our industry, we find that the remodeling jobs grew by another 1,600 workers in August (the latest month for which data is available). Even though it is relatively strong, there’s a clear reduction in the number of workers added compared to the first half of the year. Between January and June of this year, the industry added an average of 3,050 workers per month — nearly double September’s pace.
Women in the Work Force
It is well known that women entered the labor force in droves after the World War II. In fact, the percentage of women in the labor force nearly doubled in those 70 years, from 32% in 1950 to the current 57%. Most of those gains, however came between 1950 and 1990. In contrast, men’s participation fell from 89% to the 69% during the same period, but it is still currently about 10 percentage points higher than the women’s rate.
Naturally, there are some fields where women are more active participants. In fields within our industry, we find that nearly three-quarters of interior designers are women. Within architecture, four in ten workers are female. But the percentage drops sharply for areas that are closer to the physical construction of buildings, as illustrated in the table below.
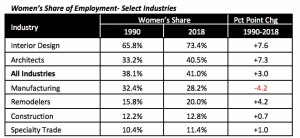
While women’s share of most industries has increased, the increase is notably higher in areas where they already predominate, such as interior design, which saw its share of women workers rise by 7.6 percentage points over the last 28 years.
And, logically, the percentage of increase is lowest in areas where the share of women workers is lowest, such as specialty trades or construction.
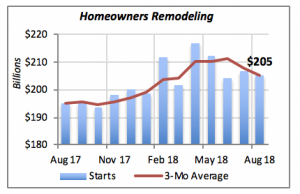
Remodeling Spending Ebbs
Is the residential market getting softer? It appears so. The latest data on homeowners’ remodeling spending reveals a modest decline in August; a drop of 0.6% to an annualized rate of $205 billion.
As seen in the chart below, spending has fallen in four of the last six months. Spending peaked in April 2018, when it was running at an annualized rate of $217 billion. Its current pace is 5% lower than that. The red line highlights the slowly declining trend in remodeling spending.
Manufacturing Shipments Rebound
Shipments of manufacturers’ durable goods rebounded in August, gaining 0.8% over the prior month, for a total of $253 billion. Year-to-date through August, U.S. manufacturers have shipped durable goods valued at $1.99 trillion, just under 7% over the volume shipped last year during the same period.
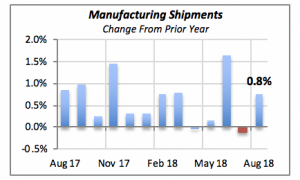
Incidentally, durable goods represent half of all goods shipped. The other 50 percent, called non-durable goods is made of products that generally are purchase frequently and consumed in a short period of time, like groceries, grain products, beverages, dairy products, etc. Durable goods, on the other hand, last a long time, such as computers, automobiles, etc.
New orders for durable goods, an indicator of future manufacturing business, rose 4.5% in August to $260 billion. However, this robust increase followed a 1.2% decline the previous month, even though orders have risen in two of the last three months.
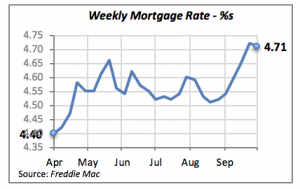
Mortgage Rates Ease
The 30-year fixed mortgage rate eased by just one basis point (0.01%) last week, perhaps temporarily breaking the upward trend evident over the last few weeks.
Manuel Gutierrez, Consulting Economist to NKBA
Explanation of NKBA’s Economic Indicators Dashboard
Note that all the data, except for “mortgage rate” and “appliance-store sales” are seasonally adjusted and are represented at annual rates.
Remodeling Expenditures. This is the amount of money spent on home improvement projects during the month in question. It covers all work done for privately owned homes (excludes rentals, etc.). The data are in billions of dollars and are issued monthly by the U.S. Department of Commerce.
Single-Family Starts. This is the number of single-family houses for which construction was started in the given month. The data are in thousands of houses and are issued monthly by the U.S. Department of Commerce.
Existing-Home Sales. These data are issued monthly by the National Association of Realtors and capture the number of existing homes that were sold in the previous month.
High-End Home Sales. This series are sales of new homes priced at $500,000 and higher. The data are released quarterly by the U.S. Department of Commerce and are not seasonally adjusted. Thus, a valid comparison is made to the same quarter of prior year.
Mortgage Rate. We have chosen the rate on 30-year conventional loans that is issued by the Federal Home Loan Mortgage Corporation (known popularly as Freddie Mac.) Although there are a large number of mortgage instruments available to consumers, this one is still the most commonly used.
Employees in Residential Remodeling. This indicator denotes the number of individuals employed in construction firms that do mostly residential remodeling work.
Building-Materials Sales. These data, released monthly by the Department of Commerce, capture total sales of building materials, regardless of whether consumers or contractors purchased them. However, we should caution that the data also includes sales to projects other than residential houses.
Appliance-Store Sales.This driver captures the monthly sales of stores that sell mostly household appliances; the data are stated at an annual rate. We should not confuse this driver with total appliance sales, since they are sold by other types of stores such as home centers.
We hope you find this dashboard useful as a general guide to the state of our industry. Please contact us if you would like to see further detail.


