

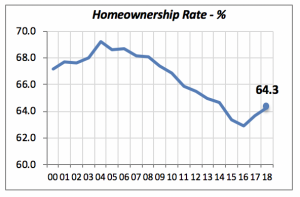
Homeownership Rates Improve
Along with the stronger economy, more individuals or couples are better able to set up as separate households; therefore, the number of households has increased. Of course, we do not know how many of the proverbial “grown children living in their parents’ basements” are actually emerging to establish a household, but the large jump in the number of households in the second quarter suggests that many of them are.
More interesting to our industry is that the vast majority of the 2.3 million new households became homeowners, rather than renters. Those new homeowners will begin to remodel and improve their homes within one or two years, and many of them will likely use the services of designers. This is good news to the design and remodeling industry and to NKBA members.
These new homeowners brought the homeownership rate to 64.3%, over a half-percent higher than it was a year ago. This is the highest since the second quarter of 2014, when the rate was 64.7%.
This begs the question: how can the number of households increase by 2.34 million when over the last 12 months, builders added only 1.47 million units to the nation’s housing stock? The answer lies partly in the fact that there were a large number of vacant units, either for sale or rent, that are filling this need.
Actually, at the end of the second quarter of this year, there were a total of 17 million vacant homes, or 12% of the U.S. housing stock.
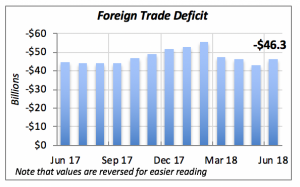
Foreign Trade Deficit Grows
The U.S. trade balance deteriorated in June to $46.3 billion, 7.2% worse than the prior month, when the deficit was $43.2 billion. In fact, June’s increase contradicts the declining trend evident since February, when the deficit began to fall (i.e., improve).
The worsening deficit is the result of a 0.7% drop in the value of exports, while U.S. imports from other countries rose by 0.6%. Incidentally, June’s drop is only the second time, in over a year, when the volume of exports fell.
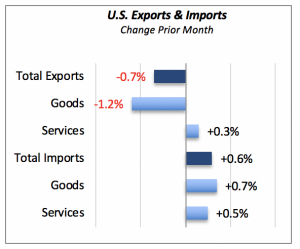
In fact, for the first half of the year, exports were up 9% from a year ago, to a total of $1.26 trillion, compared to $1.16 trillion last year. Year-to-date imports are also up compared to last year, by a slightly smaller 8.6%, to $1.55 trillion.
While the final outcome of the current disputes on trade between the administration and foreign countries is unpredictable, the general expectation is that an agreement will be reached — but whether it’ll be favorable or unfavorable is unknown.
Mortgage Rates Remain Stable
The 30-year mortgage rate remained virtually unchanged last week, falling by just 0.01% to 4.59%. As previously noted, mortgage rates have not changed materially over the last two months, meaning that housing construction and home sales are not hindered by the higher costs implied by higher mortgage rates.
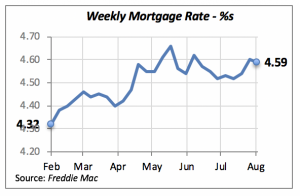
However, compared to six months ago, when rates hovered around 4.32%, home purchases have become less affordable. The housing affordability index, issued by the National Association of Realtors, has declined more than 15% from its February level of 159.3 to its current level of 134.8.
Manuel Gutierrez, Consulting Economist to NKBA
Explanation of NKBA’s Economic Indicators Dashboard
The dashboard displays the latest value of each economic indicator with a colored triangle that highlights visually the recent trend for each of the drivers. “Green” is a positive signal, indicating that the latest value is improving; “Yellow,” as it’s commonly understood, denotes caution because the variable may be changing direction; “Red” indicates that the variable in question is declining, both in its current value and in relation to the recent past.
Note that all the data, except for “mortgage rate” and “appliance-store sales” are seasonally adjusted and are represented at annual rates.
Remodeling Expenditures. This is the amount of money spent on home improvement projects during the month in question. It covers all work done for privately owned homes (excludes rentals, etc.). The data are in billions of dollars and are issued monthly by the U.S. Department of Commerce.
Single-Family Starts. This is the number of single-family houses for which construction was started in the given month. The data are in thousands of houses and are issued monthly by the U.S. Department of Commerce.
Existing-Home Sales. These data are issued monthly by the National Association of Realtors and capture the number of existing homes that were sold in the previous month.
High-End Home Sales. This series are sales of new homes priced at $500,000 and higher. The data are released quarterly by the U.S. Department of Commerce and are not seasonally adjusted. Thus, a valid comparison is made to the same quarter of prior year.
Mortgage Rate. We have chosen the rate on 30-year conventional loans that is issued by the Federal Home Loan Mortgage Corporation (known popularly as Freddie Mac.) Although there are a large number of mortgage instruments available to consumers, this one is still the most commonly used.
Employees in Residential Remodeling. This indicator denotes the number of individuals employed in construction firms that do mostly residential remodeling work.
Building-Materials Sales. These data, released monthly by the Department of Commerce, capture total sales of building materials, regardless of whether consumers or contractors purchased them. However, we should caution that the data also includes sales to projects other than residential houses.
Appliance-Store Sales. This driver captures the monthly sales of stores that sell mostly household appliances; the data are stated at an annual rate. We should not confuse this driver with total appliance sales, since they are sold by other types of stores such as home centers.
We hope you find this dashboard useful as a general guide to the state of our industry. Please contact us if you would like to see further detail.


