

Conflicting Economic News on the Horizon
While last week’s release of June’s employment report again signaled the robustness of the U.S. economy, the Trump administration’s trade disputes with China and other trading partners puts a dark cloud in the horizon. Obviously, the 213,000 jobs created in June have a favorable immediate effect, but the increase in U.S. import tariffs has a more pernicious delayed impact.
Raising import tariffs automatically boosts the cost to American consumers of imported goods, although many of those goods are already in stores or on the way to the U.S. (presumably without those additional costs). So consumers will not see their impact right away.
The expected retaliation of other countries, such as China’s or Canada’s threats to raise tariffs against U.S.-made goods, will have an impact on American manufacturers, who are likely to lose that business unless they are able to find other markets for their products. The final result, in the worst-case scenario, is that they will be forced to reduce production and lay off some workers.
Jobs Situation Remains Strong
As stated, the number of people employed rose in June by 213,000 workers. Private as well as public sectors contributed to the increase. The private sector added 202,000 jobs, shown by the red line in the chart below, with the government accounting for the difference of 11,000 jobs.
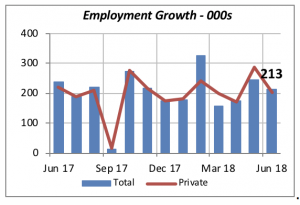
As has been the case for over a year now, employment at the Federal level has been declining while state and local governments continue to add workers.
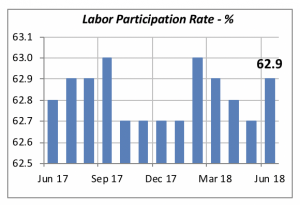
Another bit of good news is that more workers joined the labor force in June, after several months of declines.
The labor participation rate, that is the number of employed plus those who are actively looking for a job as a percentage of the total working-age population, rose to 62.9% in June following several months of declines.
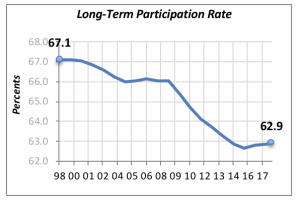
Even though this increase is welcome news, it is hardly sufficient to erase the steady decline in the participation rate that we’ve seen since the late 1990s. Overall participation rate peaked at the end of the 20th century, when it was 67.1%. Since then, it has fallen by 4.2 percentage points. Unless this long-term trend is reversed, we should expect further declines as more and more Baby Boomers reach retirement age.
Remodeling Expenditures Rise
The residential remodeling market is thriving. Homeowners increased their spending on remodeling in May to an annualized rate of $203.7 billion, up nearly 1 percent from the prior month.
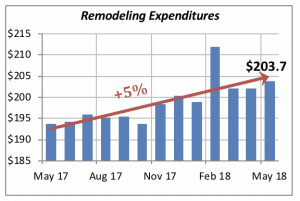
This output is running 5% higher than it was a year ago, when homeowners were spending for remodeling at the rate of just under $195 billion.
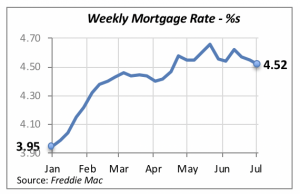
Mortgage Rates Slip Again
Another week brought another drop in mortgage rates. Although the recent declines are relatively small, only a few basis points each week, their cumulative effect should be favorable to the housing markets. Lower rates simply mean that more prospective home buyers will be able to afford a home. Also, the falling rates help absorb the financial impact that rising home prices have on prospective homeowners.
Manuel Gutierrez, Consulting Economist to NKBA
Explanation of NKBA’s Economic Indicators Dashboard
The dashboard displays the latest value of each economic indicator with a colored triangle that highlights visually the recent trend for each of the drivers. “Green” is a positive signal, indicating that the latest value is improving; “Yellow,” as it’s commonly understood, denotes caution because the variable may be changing direction; “Red” indicates that the variable in question is declining, both in its current value and in relation to the recent past.
Note that all the data, except for “mortgage rate” and “appliance-store sales” are seasonally adjusted and are represented at annual rates.
Remodeling Expenditures. This is the amount of money spent on home improvement projects during the month in question. It covers all work done for privately owned homes (excludes rentals, etc.). The data are in billions of dollars and are issued monthly by the U.S. Department of Commerce.
Single-Family Starts. This is the number of single-family houses for which construction was started in the given month. The data are in thousands of houses and are issued monthly by the U.S. Department of Commerce.
Existing-Home Sales. These data are issued monthly by the National Association of Realtors and capture the number of existing homes that were sold in the previous month.
High-End Home Sales. This series are sales of new homes priced at $750,000 and higher. The data are released quarterly by the U.S. Department of Commerce and are not seasonally adjusted. Thus, a valid comparison is made to the same quarter of prior year.
Mortgage Rate. We have chosen the rate on 30-year conventional loans that is issued by the Federal Home Loan Mortgage Corporation (known popularly as Freddie Mac.) Although there are a large number of mortgage instruments available to consumers, this one is still the most commonly used.
Employees in Residential Remodeling. This indicator denotes the number of individuals employed in construction firms that do mostly residential remodeling work.
Building-Materials Sales. These data, released monthly by the Department of Commerce, capture total sales of building materials, regardless of whether consumers or contractors purchased them. However, we should caution that the data also includes sales to projects other than residential houses.
Appliance-Store Sales. This driver captures the monthly sales of stores that sell mostly household appliances; the data are stated at an annual rate. We should not confuse this driver with total appliance sales, since they are sold by other types of stores such as home centers, for instance.
We hope you find this dashboard useful as a general guide to the state of our industry. Please contact us if you would like to see further detail.


