

Jobs Continue To Roll
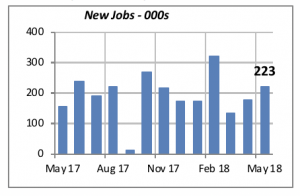
The monthly employment picture brightened with last Friday’s report, revealing that 223,000 jobs were created in May. This brings the total for the first five months of the year to 1.04 million new jobs. Through May, 175,000 more jobs have been created than were created during the same period last year.
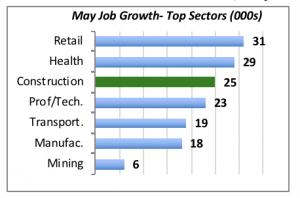
Virtually all work categories increased in May. The chart below lists the top seven categories, that together accounted for two-thirds of May’s job growth. Retail leads with 31,000 new jobs, but ranking third in employment growth is Construction, contributing 25,000 jobs. The construction sector has created 286,000 jobs over the last 12 months.
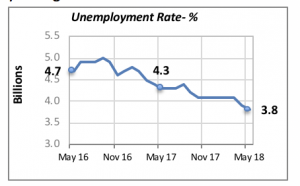
The unemployment rate moved down further to 3.8% — its lowest rate in nearly 50 years. The rate has dropped by 0.5% over the last 12 months, and it is nearly 1% below what it was two years ago.
Remodeling Employment
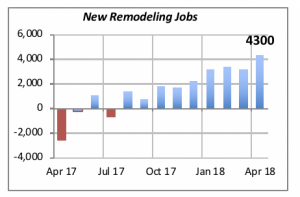
Further, within the construction sector, employment for remodeling rose by 4,300 workers in April, the largest gain in more than a year. Moreover, remodelers have added a greater number of jobs each month since July of last year.
Note that the remodeling data reflects businesses that are engaged in remodeling for all types of projects, including non-residential jobs.
Also, in April, homeowners’ spending for remodeling their homes reached an annualized rate of $208.6 billion. The 7.4% increase from the prior month reversed the sharp decline recorded in March.
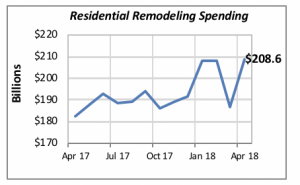
As shown in the chart above, in three of the last four months, homeowners have been spending at a rate exceeding $208 billion annually. This is the highest volume ever recorded on remodeling expenditures.
Mortgage Rates Ease Again
More good news for consumers: mortgage rates fell last week to an average of 4.56% — down 10 basis points from the prior week. This decline, although modest, will make it marginally easier for some consumers to purchase a home.
Manuel Gutierrez, Consulting Economist to NKBA
Explanation of NKBA’s Economic Indicators Dashboard
The dashboard displays the latest value of each economic indicator with a colored triangle that highlights visually the recent trend for each of the drivers. “Green” is a positive signal, indicating that the latest value is improving; “Yellow,” as it’s commonly understood, denotes caution because the variable may be changing direction; “Red” indicates that the variable in question is declining, both in its current value and in relation to the recent past.
Note that all the data, except for “mortgage rate” and “appliance-store sales” are seasonally adjusted and are represented at annual rates.
Remodeling Expenditures. This is the amount of money spent on home improvement projects during the month in question. It covers all work done for privately owned homes (excludes rentals, etc.). The data are in billions of dollars and are issued monthly by the U.S. Department of Commerce.
Single-Family Starts. This is the number of single-family houses for which construction was started in the given month. The data are in thousands of houses and are issued monthly by the U.S. Department of Commerce.
Existing-Home Sales. These data are issued monthly by the National Association of Realtors and capture the number of existing homes that were sold in the previous month.
High-End Home Sales. This series are sales of new homes priced at $750,000 and higher. The data are released quarterly by the U.S. Department of Commerce and are not seasonally adjusted. Thus, a valid comparison is made to the same quarter of prior year.
Mortgage Rate. We have chosen the rate on 30-year conventional loans that is issued by the Federal Home Loan Mortgage Corporation (known popularly as Freddie Mac.) Although there are a large number of mortgage instruments available to consumers, this one is still the most commonly used.
Employees in Residential Remodeling. This indicator denotes the number of individuals employed in construction firms that do mostly residential remodeling work.
Building-Materials Sales. These data, released monthly by the Department of Commerce, capture total sales of building materials, regardless of whether consumers or contractors purchased them. However, we should caution that the data also includes sales to projects other than residential houses.
Appliance-Store Sales. This driver captures the monthly sales of stores that sell mostly household appliances; the data are stated at an annual rate. We should not confuse this driver with total appliance sales, since they are sold by other types of stores such as home centers, for instance.
We hope you find this dashboard useful as a general guide to the state of our industry. Please contact us if you would like to see further detail.


