

New Housing Slowly Improves
Housing starts jumped a surprisingly strong 5% last month to an annual rate of 1.35 million units. Although this followed a 3.1% decline the prior month, total housing starts this year are running at their highest rate since 2007. This is good news — even though it may be temporary — since other factors, such as rising mortgage rates, may slow down the improvements.
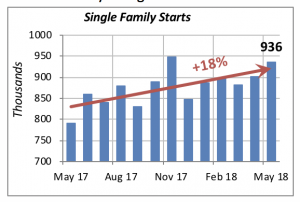
Both types of new housing construction, single-family and multifamily units, rose last month. Single-family starts, shown in the chart below, moved up to an annualized rate of 936,000 units, a 3.9% gain from the prior month. And, as can also be seen in the chart, that’s up a whopping 18.3% from a year ago.
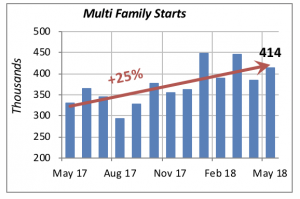
The construction of new multifamily units increased 7.5% in May to an annualized rate of 414,000 units. Similar to the single-family sector, construction of multifamily units is running significantly higher than a year ago. In fact, May’s activity is 25% above the same month last year.
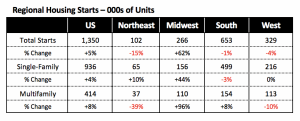
Regionally, the gain in overall housing starts was due to a sharp increase in the Midwest, while the other three regions saw declines. In single-family construction, however, three of the regions saw increases. The South, which accounts for over half of the nation’s new housing starts, had a 3% decline.
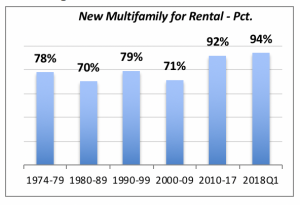
Currently, the vast majority of homes built in multifamily buildings are destined for rental purposes. This is a sharp contrast to historical norms, when rental units represented between 70% and 80% of new multifamily houses. The higher percentage of new units built for rent that we’ve seen since the turn of the century reflects the difficulty that many households have in becoming homeowners. High levels of student debt, currently estimated at over $1.2 trillion, is a critical factor preventing many young people from establishing a household, much less becoming homeowners.
Home Sales Stagnate
The housing market continues to be plagued by low inventory levels that are preventing any significant improvement in home sales. Thus, sales of existing homes fell slightly, by 0.4% in May, to an annualized rate of 5.43 million units. As seen in the chart below, last month’s decline followed a much larger drop of 2.7% in the previous month.
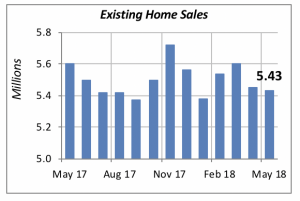
Moreover, unlike new construction, sales of existing homes have not improved appreciably over the last 12 months. In May, sales were running 3% below what they were a year ago. A primary reason is the lack of inventory of homes for sale.
State of the Nation’s Housing
Last week, the Joint Center for Housing Studies at Harvard University released the 2018 version of its annual research study on housing and demographics.
Based on its research, the Joint Center report highlighted six general themes.
- Low inventory of houses for sale. The Joint Center researchers feel that the lack of for-sale inventory is a critical issue, as has been well documented.
- Affordability issues. The report indicates that even though it’s not a large issue yet, rising home prices are beginning to put pressures on affordability.
- Homeownership has improved overall, but select groups are not keeping up. The report shows that the homeownership rate for young adults and blacks remains at historically low levels.
- Rental household growth After several years of growth in rental households, they plummeted last year.
- Renters face higher costs. Even though fewer households have affordability problems today, the report finds a near-record of renters who face high costs.
- The number of households continues to grow, partly due to aging of Millennials and Baby Boomers, but the Joint Center feels that immigration is also a concern.
You can download a copy of the full report here: http://www.jchs.harvard.edu/state-nations-housing-2018
Mortgage Rates Ebb But Are Still Relatively High
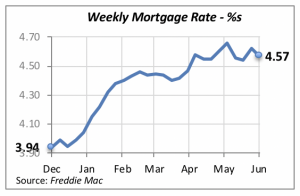
Mortgage rates moderated slightly last week, falling by five basis points to 4.57%. Nonetheless, rates are at the highest levels in nearly five years and are beginning to hinder home sales.
The impact of higher mortgage rates in the remodeling market is much smaller. This is because the majority of remodeling projects are financed by consumers using their savings, or other sources not tied to the mortgage markets. So while we may expect to see little improvement in the new residential construction or home sales markets, residential remodeling should continue to grow.
Manuel Gutierrez, Consulting Economist to NKBA
Explanation of NKBA’s Economic Indicators Dashboard
The dashboard displays the latest value of each economic indicator with a colored triangle that highlights visually the recent trend for each of the drivers. “Green” is a positive signal, indicating that the latest value is improving; “Yellow,” as it’s commonly understood, denotes caution because the variable may be changing direction; “Red” indicates that the variable in question is declining, both in its current value and in relation to the recent past.
Note that all the data, except for “mortgage rate” and “appliance-store sales” are seasonally adjusted and are represented at annual rates.
Remodeling Expenditures. This is the amount of money spent on home improvement projects during the month in question. It covers all work done for privately owned homes (excludes rentals, etc.). The data are in billions of dollars and are issued monthly by the U.S. Department of Commerce.
Single-Family Starts. This is the number of single-family houses for which construction was started in the given month. The data are in thousands of houses and are issued monthly by the U.S. Department of Commerce.
Existing-Home Sales. These data are issued monthly by the National Association of Realtors and capture the number of existing homes that were sold in the previous month.
High-End Home Sales. This series are sales of new homes priced at $750,000 and higher. The data are released quarterly by the U.S. Department of Commerce and are not seasonally adjusted. Thus, a valid comparison is made to the same quarter of prior year.
Mortgage Rate. We have chosen the rate on 30-year conventional loans that is issued by the Federal Home Loan Mortgage Corporation (known popularly as Freddie Mac.) Although there are a large number of mortgage instruments available to consumers, this one is still the most commonly used.
Employees in Residential Remodeling. This indicator denotes the number of individuals employed in construction firms that do mostly residential remodeling work.
Building-Materials Sales. These data, released monthly by the Department of Commerce, capture total sales of building materials, regardless of whether consumers or contractors purchased them. However, we should caution that the data also includes sales to projects other than residential houses.
Appliance-Store Sales. This driver captures the monthly sales of stores that sell mostly household appliances; the data are stated at an annual rate. We should not confuse this driver with total appliance sales, since they are sold by other types of stores such as home centers, for instance.
We hope you find this dashboard useful as a general guide to the state of our industry. Please contact us if you would like to see further detail.


