

Single-Family Starts Up, Multifamily Down
After last week’s headline that February housing starts had fallen by 7%, leading to a gloomy outlook for new housing construction, this week, the forecast appears brighter. A quick glance at the two major components of housing — construction of single-family and multifamily units — reveals a glimmer of good news.
The single-family component, which is a mainstay of many businesses in the remodeling sphere, actually improved in February, albeit by a modest 2.9%. The month ended with an annualized rate of 902,000 housing starts. Although not a record, it is the second-highest rate in a year.
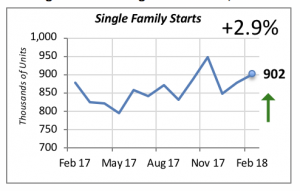
This is the second consecutive month of gains in single-family housing. It appears that housing construction continues to fill, at least partially, the gap in housing availability that has hindered home sales. The overall rising trend in single-family starts has been continuing since May 2017.
Contrasting the favorable picture in single-family starts, construction of multifamily units fell again in February, to an annualized rate of 334,000.
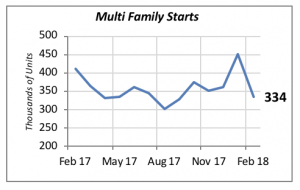
January’s surprising gain of nearly 25%, that had brought multifamily construction to 452,000 starts, a level not seen in a year, was more than reversed in February with a 26% drop. It is not unusual, however, for multifamily starts to swing widely from month to month.
Optimism Prevails
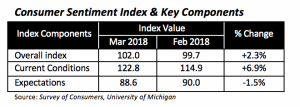
The federal tax law enacted late last year is having a direct impact on consumers. The preliminary March reading of the University of Michigan’s survey of consumer sentiment jumped to 102 — its highest value since 2004 — and it reflects favorable views among consumers in the bottom third of the income scale.
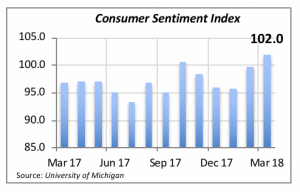
However, while consumers view their current condition favorably, they do not have such sanguine opinion about the near future. Concerns about rising inflation and increasing interest rates have tempered their expectations; this is reflected in a decline in this index component.
Sales of Building Materials
We have also updated two other indicators: Sales of Building Materials and Sales at Appliance Stores.
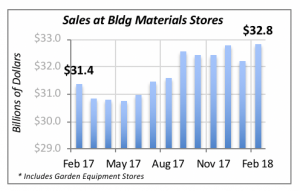
Sales of building materials rose 1.9% in February to $32.8 billion, slightly above the last five months’ average. The chart below shows that sales have remained within a narrow band between $32 billion and $33 billion a month since last September.
But appliance stores continue to lose ground to other types of outlets. Sales at these stores in January were at their lowest in seven years. The chart below displays sales for January of this year, marked by the dot, and monthly sales for the last four years.
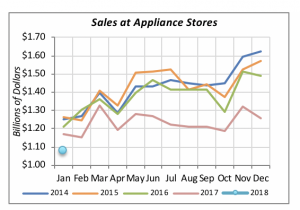
Because appliance sales data are not adjusted for seasonally, we can’t compare January and December sales. Rather, sales are compared with the same month in prior years, which reveals that last year, sales were lower in every month, and 2018 is starting with an even worse performance.
Mortgage Rates
Mortgage rates took a small breather last week, falling by two basis points (0.02%) to 4.44% — the first dip since early January.

This is not an indicator that the rising trend in interest rates has been reversed. The general expectation is that interest rates, including mortgage rates, will continue to move up this year.
Two main factors are behind this movement. One is that the Federal Reserve Bank will continue to follow tightening policies by raising the federal funds rate. The second is the increasing demand for funds emanating from both a booming economy and the Federal government’s continuous demands for cash.
The latter is fueled by the government continuing to operate on a deficit basis, whereby it needs to borrow funds to maintain its operations.
Manuel Gutierrez, Consulting Economist to NKBA
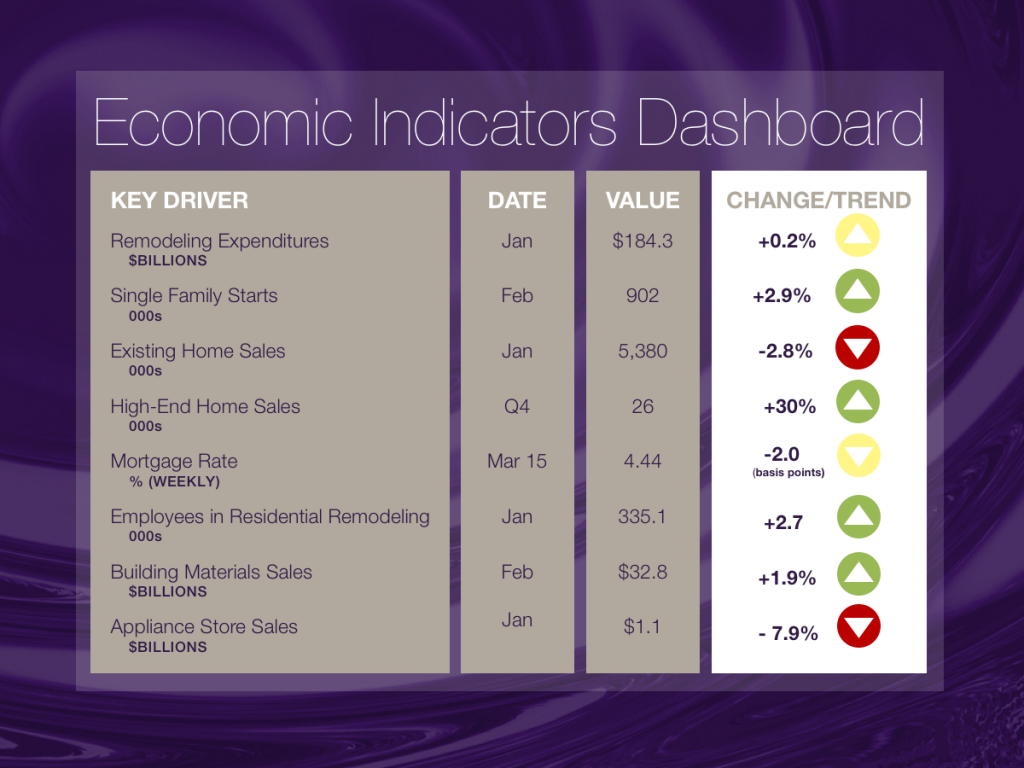
Explanation of NKBA’s Economic Indicators Dashboard
The dashboard displays the latest value of each economic indicator with a colored triangle that highlights visually the recent trend for each of the drivers. “Green” is a positive signal, indicating that the latest value is improving; “Yellow,” as it’s commonly understood, denotes caution because the variable may be changing direction; “Red” indicates that the variable in question is declining, both in its current value and in relation to the recent past.
Note that all the data, except for “mortgage rate” and “appliance-store sales” are seasonally adjusted and are represented at annual rates.
Remodeling Expenditures. This is the amount of money spent on home improvement projects during the month in question. It covers all work done for privately owned homes (excludes rentals, etc.). The data are in billions of dollars and are issued monthly by the U.S. Department of Commerce.
Single-Family Starts. This is the number of single-family houses for which construction was started in the given month. The data are in thousands of houses and are issued monthly by the U.S. Department of Commerce.
Existing-Home Sales. These data are issued monthly by the National Association of Realtors and capture the number of existing homes that were sold in the previous month.
High-End Home Sales. This series are sales of new homes priced at $750,000 and higher. The data are released quarterly by the U.S. Department of Commerce and are not seasonally adjusted. Thus, a valid comparison is made to the same quarter of prior year.
Mortgage Rate. We have chosen the rate on 30-year conventional loans that is issued by the Federal Home Loan Mortgage Corporation (known popularly as Freddie Mac.) Although there are a large number of mortgage instruments available to consumers, this one is still the most commonly used.
Employees in Residential Remodeling. This indicator denotes the number of individuals employed in construction firms that do mostly residential remodeling work.
Building-Materials Sales. These data, released monthly by the Department of Commerce, capture total sales of building materials, regardless of whether consumers or contractors purchased them. However, we should caution that the data also includes sales to projects other than residential houses.
Appliance-Store Sales. This driver captures the monthly sales of stores that sell mostly household appliances; the data are stated at an annual rate. We should not confuse this driver with total appliance sales, since they are sold by other types of stores such as home centers, for instance.
We hope you find this dashboard useful as a general guide to the state of our industry. Please contact us if you would like to see further detail.


