

Home Sales Continue on Weaker Pace
The year has started with a weak home sales market, which is not a positive sign for the remodeling industry. Sales of existing homes fell 3.2% in January, on the heels of a similar decline — 2.8% — in December. Thus, homes were sold in January at an annual rate of 5.38 million units, the lowest in well over a year.
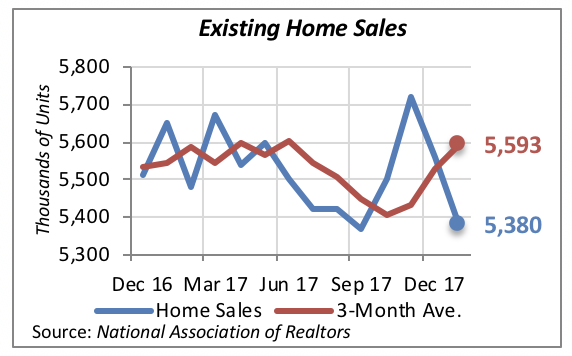
The main culprit continues to be the supply side of the equation. Despite a 4.1% rise in homes on the market, to 1.52 million in January, inventories remain low, which is hampering sales. The reason is that, as in any market, low supply and relatively strong demand normally result in driving prices higher. And such is the case in the home sales market, where prices rose 5.8% in January, compared to a year before.
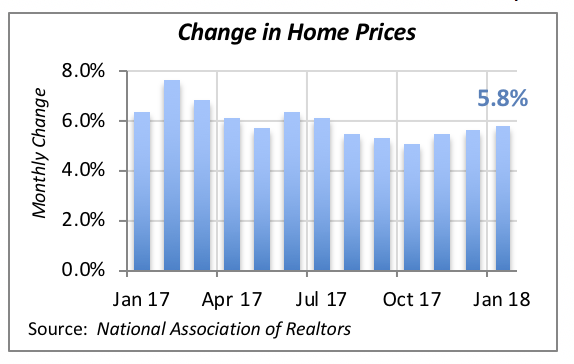
Rising prices, along with rising mortgage rates, indicate that there will be no material improvement in home sales in the near future, as this one-two punch will continue to put pressure on some potential buyers by pricing them out of the market.
Consumer Optimism Rises
In what could be a counterbalance to the current slump in home sales and its potential influence on the remodeling market, consumer sentiment has been on the upswing. Even though it’s still too soon to detect any impact that the federal tax changes enacted last year will have on the real economy, the opinions and feelings among consumers towards their future prospects have improved markedly.
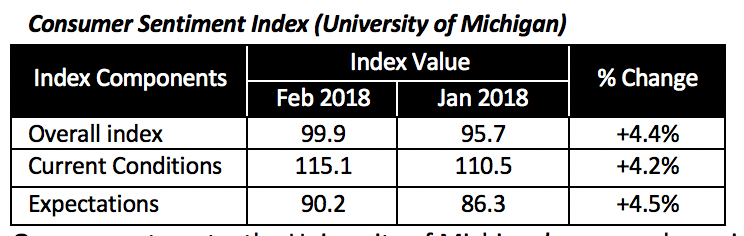
The Index of Consumer Sentiment rose over the past month by 4.4% to a value of 99.9. Although this is not its highest value in recent history — October’s value was 100.7 — it is remarkable because the gain reported this month reversed the prior three months’ losses.
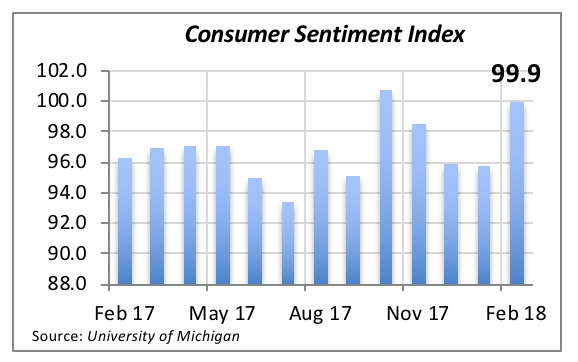
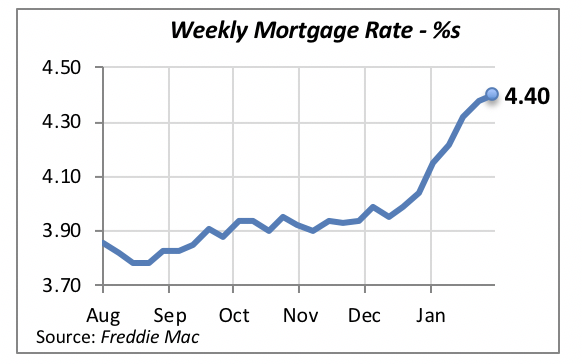
In fact, as seen in the chart above, the last time the index recorded an increase of similar magnitude was in October 2016, right before the presidential election.
Not surprisingly, both major contributing elements to the index improved this month as well.
The “current conditions” component rose by 4.2% and, as its name indicates, this captures the assessment of consumers’ views on their current economic and financial situation compared to what it was three months before.
Similarly, the “expectations” index component rose by 4.5% in February. It captures consumers’ views on their future financial prospects as well as their opinion on the trajectory of the overall economy. The increase in the expectations index clearly indicates that consumers are optimistic about the economy in the months ahead.
On a separate note, the University of Michigan’s survey also pointed out that consumers have favorable opinion of government policies — most likely a reference to the tax reform.
Mortgage Rates Continue Climb
Interest rates continue trending upward. The 30-year fixed mortgage rate rose another two basis points last week to an average of 4.4%.
It should come as no surprise that this current rising path of mortgage rates will continue for the next year or so. Economic growth has been strong in the last three quarters and is projected to remain strong at 2.5% to 3% this year. And consumers’ wages and income have been finally rising.
These events lead to the conclusion that the Fed very likely will raise interest rates several times this year — and these increases will naturally show up in mortgage rates that constrain home sales and housing starts.
Manuel Gutierrez, Consulting Economist to NKBA
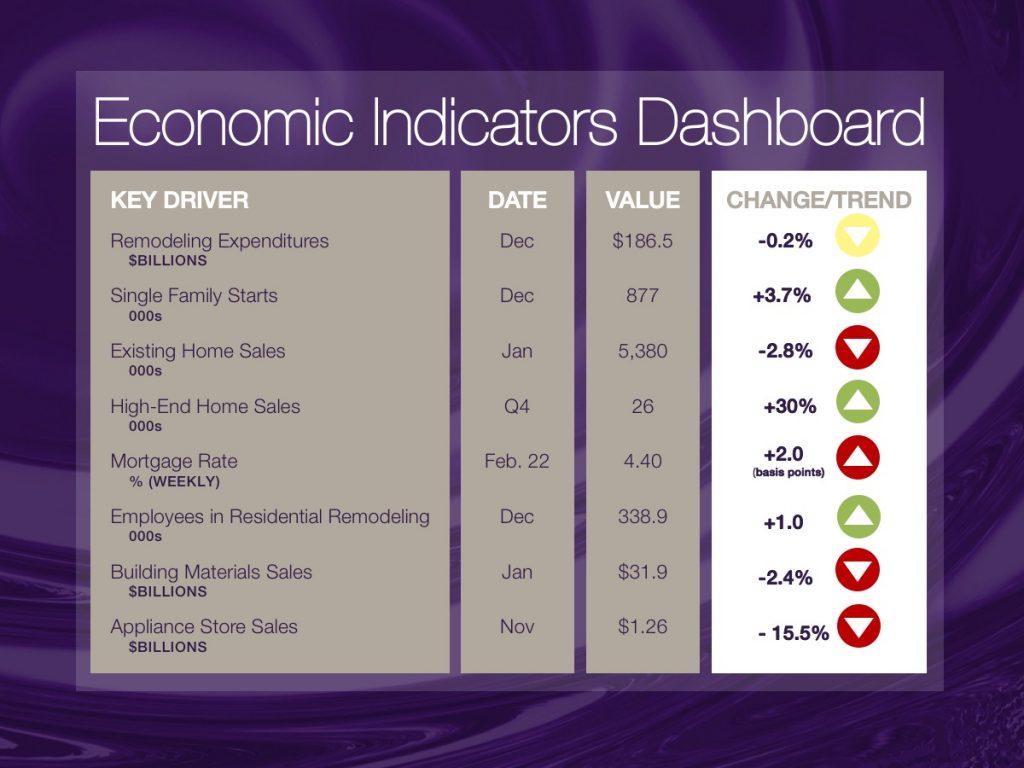
Explanation of NKBA’s Economic Indicators Dashboard
The dashboard displays the latest value of each economic indicator with a colored triangle that highlights visually the recent trend for each of the drivers. “Green” is a positive signal, indicating that the latest value is improving; “Yellow,” as it’s commonly understood, denotes caution because the variable may be changing direction; “Red” indicates that the variable in question is declining, both in its current value and in relation to the recent past.
Note that all the data, except for “mortgage rate” and “appliance-store sales” are seasonally adjusted and are represented at annual rates.
Remodeling Expenditures. This is the amount of money spent on home improvement projects during the month in question. It covers all work done for privately owned homes (excludes rentals, etc.). The data are in billions of dollars and are issued monthly by the U.S. Department of Commerce.
Single-Family Starts. This is the number of single-family houses for which construction was started in the given month. The data are in thousands of houses and are issued monthly by the U.S. Department of Commerce.
Existing-Home Sales. These data are issued monthly by the National Association of Realtors and capture the number of existing homes that were sold in the previous month.
High-End Home Sales. This series are sales of new homes priced at $750,000 and higher. The data are released quarterly by the U.S. Department of Commerce and are not seasonally adjusted. Thus, a valid comparison is made to the same quarter of prior year.
Mortgage Rate. We have chosen the rate on 30-year conventional loans that is issued by the Federal Home Loan Mortgage Corporation (known popularly as Freddie Mac.) Although there are a large number of mortgage instruments available to consumers, this one is still the most commonly used.
Employees in Residential Remodeling. This indicator denotes the number of individuals employed in construction firms that do mostly residential remodeling work.
Building-Materials Sales. These data, released monthly by the Department of Commerce, capture total sales of building materials, regardless of whether consumers or contractors purchased them. However, we should caution that the data also includes sales to projects other than residential houses.
Appliance-Store Sales. This driver captures the monthly sales of stores that sell mostly household appliances; the data are stated at an annual rate. We should not confuse this driver with total appliance sales, since they are sold by other types of stores such as home centers, for instance.
We hope you find this dashboard useful as a general guide to the state of our industry. Please contact us if you would like to see further detail.


