

New Housing Construction Up
One of the headlines in economic news last week, other than the volatile stock market, was the sharp increase in new housing starts. Total housing starts rose by nearly 10 percent in January (+9.7%) to an annual rate of 1.326 million units. This virtually matches the figure achieved in October 2016, when total starts hit a rate of 1.328 million units.
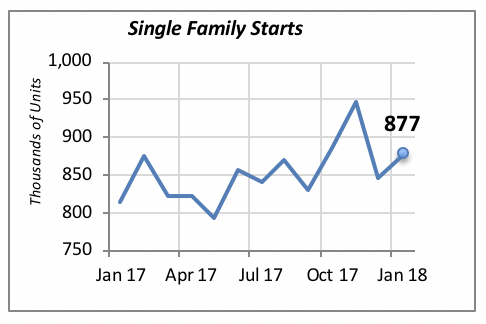
Significantly, this increase was driven by a 23.7% jump in the rate of construction of multifamily housing units; Single-family starts rose by a more modest 3.7%.
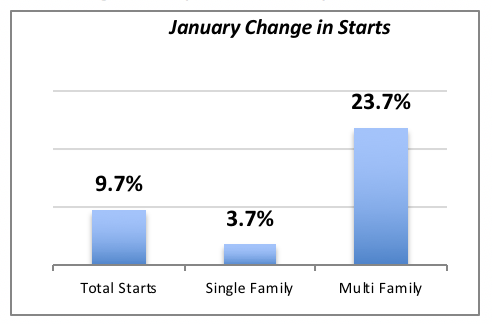
Construction of multifamily housing units tends to fluctuate sharply from month to month. For instance, the monthly change in multifamily starts has exceeded 10% four times in the last 12 months. This happened only once in the case of single-family construction.
Still, the bump in single-family starts in January, pushed the category to an annualized rate of 3.77 million units.
The recent increases in mortgage rates (discussed below) will likely begin to slow residential construction and sales. There could be an initial uptick over the next couple of months, however, as consumers who are planning to buy a house speed up the process before mortgage rates rise again.
Remodeling Continues Rising Apace
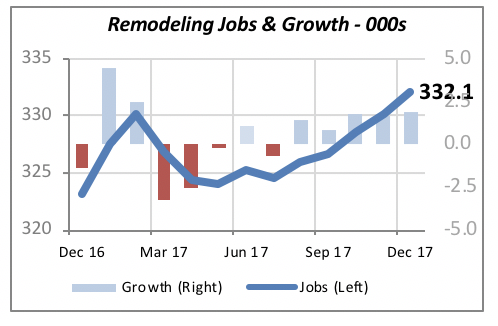
Remodeling activity remains strong and growing. The number of employees at remodeling firms rose by 1,900 workers in December, for a total of 332,100 people working in the industry. This is the fifth consecutive month of increases in remodeling employment, reflected in the chart above by the gray and red bars (note the scale for monthly growth is on the right side).
Rising mortgage rates are not expected to impact the remodeling market severely. Nearly 8 of 10 homeowners finance their residential remodeling project directly from their savings; that is, they typically don’t finance remodeling projects using borrowed money.
Sales of Building Materials Dip
Retailers of building materials reported a 2.4% decline in sales in January, to $31.9 billion. This was unexpected, given the robust sales performance over the preceding four months, when monthly sales averaged over $32.5 billion. In fact, sales have been rising since May 2017.
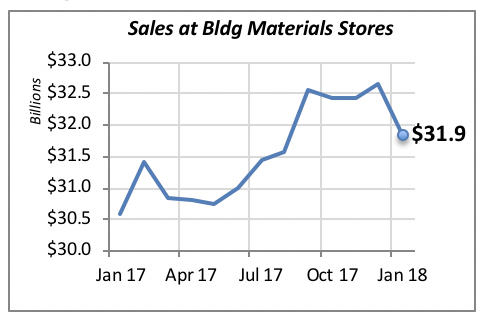
Note, however, that building-materials stores also cater to non-residential construction markets. They represent nearly half (45%) of total spending for construction in the U.S., and as such, sales at these retailers partly reflect the situation and activity of the non-residential sector.
Mortgage Rates Continue Steady Climb
As has been documented since last September, mortgage rates are continuing their steady rise. This is not good news for the remodeling and construction businesses, as higher mortgage rates imply higher housing costs (for those buying a home or remodeling) that will, like the rising cost of anything, result in a reduction in demand.
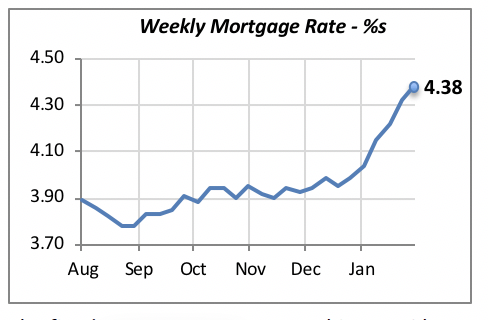
The fixed 30-year mortgage rate hit 4.38% last week, up six basis points from the prior week (one basis point equals 0.01 percent; thus, 50 basis points is half a percent.) But the rate has increased by 40 basis points (0.4 percentage points) since the beginning of the year — that’s just five weeks.
Recent developments on the inflation front — prices have been rising faster recently — suggest that the Fed may take a more aggressive posture by raising interest rates in the next few months. This means that further increases in mortgage rates could possibly constrain the housing and remodeling markets.
Manuel Gutierrez, Consulting Economist to NKBA
Explanation of NKBA’s Economic Indicators Dashboard
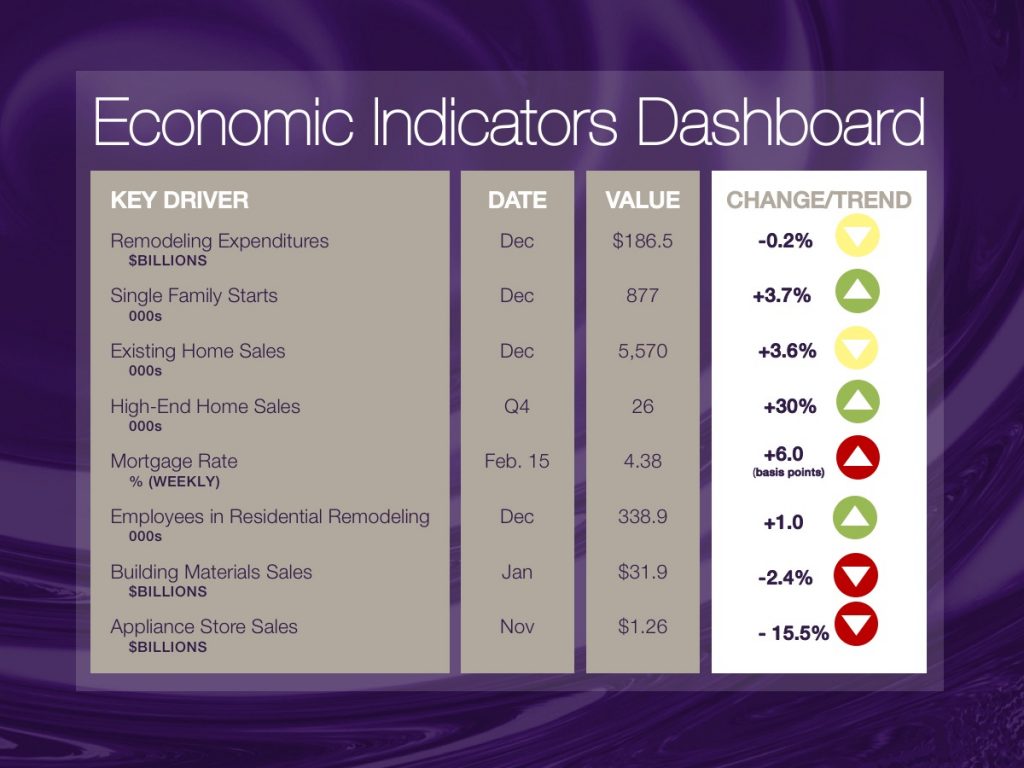
The dashboard displays the latest value of each economic indicator with a colored triangle that highlights visually the recent trend for each of the drivers. “Green” is a positive signal, indicating that the latest value is improving; “Yellow,” as it’s commonly understood, denotes caution because the variable may be changing direction; “Red” indicates that the variable in question is declining, both in its current value and in relation to the recent past.
Note that all the data, except for “mortgage rate” and “appliance-store sales” are seasonally adjusted and are represented at annual rates.
Remodeling Expenditures. This is the amount of money spent on home improvement projects during the month in question. It covers all work done for privately owned homes (excludes rentals, etc.). The data are in billions of dollars and are issued monthly by the U.S. Department of Commerce.
Single-Family Starts. This is the number of single-family houses for which construction was started in the given month. The data are in thousands of houses and are issued monthly by the U.S. Department of Commerce.
Existing-Home Sales. These data are issued monthly by the National Association of Realtors and capture the number of existing homes that were sold in the previous month.
High-End Home Sales. This series are sales of new homes priced at $750,000 and higher. The data are released quarterly by the U.S. Department of Commerce and are not seasonally adjusted. Thus, a valid comparison is made to the same quarter of prior year.
Mortgage Rate. We have chosen the rate on 30-year conventional loans that is issued by the Federal Home Loan Mortgage Corporation (known popularly as Freddie Mac.) Although there are a large number of mortgage instruments available to consumers, this one is still the most commonly used.
Employees in Residential Remodeling. This indicator denotes the number of individuals employed in construction firms that do mostly residential remodeling work.
Building-Materials Sales. These data, released monthly by the Department of Commerce, capture total sales of building materials, regardless of whether consumers or contractors purchased them. However, we should caution that the data also includes sales to projects other than residential houses.
Appliance-Store Sales. This driver captures the monthly sales of stores that sell mostly household appliances; the data are stated at an annual rate. We should not confuse this driver with total appliance sales, since they are sold by other types of stores such as home centers, for instance.
We hope you find this dashboard useful as a general guide to the state of our industry. Please contact us if you would like to see further detail.


