

New Home Sales Up Another 6.2%
Following September’s 14% jump in new home sales, October saw another 6.2% jump to reach an annual rate of 685,000 units. This is the highest level for sales since the recession of 2007-2009.
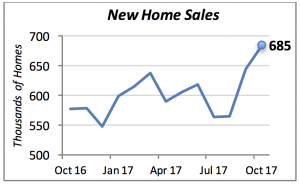
Not unexpectedly, a large number of new homes that have been sold have yet to be started. The relatively low levels of inventory have forced potential buyers to purchase a home for future delivery. Construction for 36% of the houses sold in October, or 247,000 units (at an annual rate), has not started. This is higher than the typical average of roughly 30%.
Even though average home prices rose by 5% in October to $400,200, the median price fell by 4%. This indicates that builders are moving toward selling lower-priced homes to accommodate entry-level home buyers. At the same time, the higher average prices imply that demand for higher-priced homes is also robust.
Remodeling Spending Turned Around Modestly
Homeowners increased spending to remodel their homes in October by 1.4%, to nearly $190 billion (at an annual rate.) Despite this welcome rise, spending has been relatively flat for the last four months, after the robust gains seen between October 2016 and June 2017.
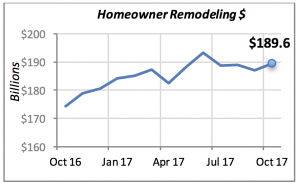
Over the last 12 months, spending has risen 8.7%. This is more modest than the growth rates recorded earlier in 2017, but in line with the expectations that the remodeling market would increase between 8% and 10 % this year.
Non-Residential Construction Is Also Positive
Construction in most residential, as well as many commercial, sectors remains favorable. The exceptions, highlighted in the table below, are manufacturing buildings (factories), whose construction is down 14% from a year ago, and office buildings, also lagging last year’s levels by 7%.
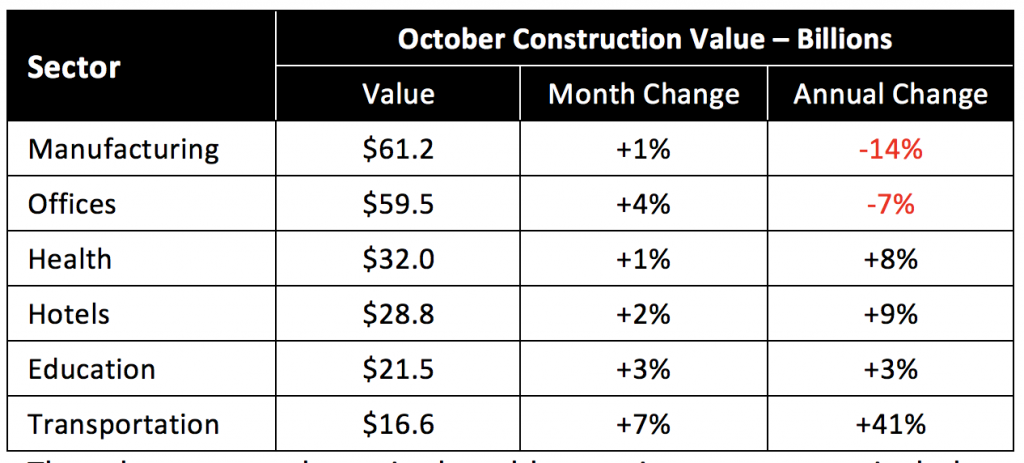
The other sectors shown in the table remain strong — particularly construction of transportation buildings, which shot up 41% compared to a year ago. Transportation buildings include transit depots, airport terminals, parking structures, etc. It’s important to note that some of these do not use services from our members.
GDP Growth Adjusted Higher
The Bureau of Economic Analysis revised its third-quarter GDP growth figure, increasing it to 3.3%. This is the second quarter of consecutive growth above 3%. Similarly, there were two consecutive quarters with robust growth — the second and third quarters of 2014, with growth of 4.6% and 5.2%, respectively — but that quickly receded to the average 2% growth of the last eight years. So, it remains to be seen whether the latest growth rates will continue or slide back to more typical performance.
Consumer spending in the third quarter was below par, at 2.3%. However, this was offset by the vigorous growth in the more important Business Investment category, which rose by 7.3% in the quarter. Most commentary in the news tends to ignore business investment, because it’s more difficult to relate it to day-to-day consumer activity. But business investment, if properly executed, should lead to increases in productivity, implying higher income for consumers in the future.
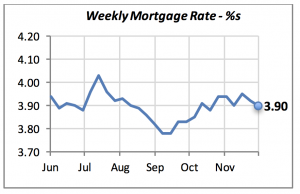
Mortgage Rates Ease Up Slightly
Mortgage rates eased further last week to 3.9%, down two basis points from the prior week. The chart shows that for all practical purposes, mortgage rates have not moved significantly in nearly two months.
Further, the appointment of a new Federal Reserve chair to take over in February signifies no major change in monetary policy is likely in the near future. Most Fed watchers concur that the appointee, Jerome Powell, will not deviate from the policies of outgoing chair Janet Yellen.
Therefore, observers don’t anticipate that the housing or remodeling markets will be derailed by an imminent hike in borrowing rates. All indications are that mortgage rates will remain favorable for the next few months, or perhaps even longer.
Manuel Gutierrez, Consulting Economist to NKBA
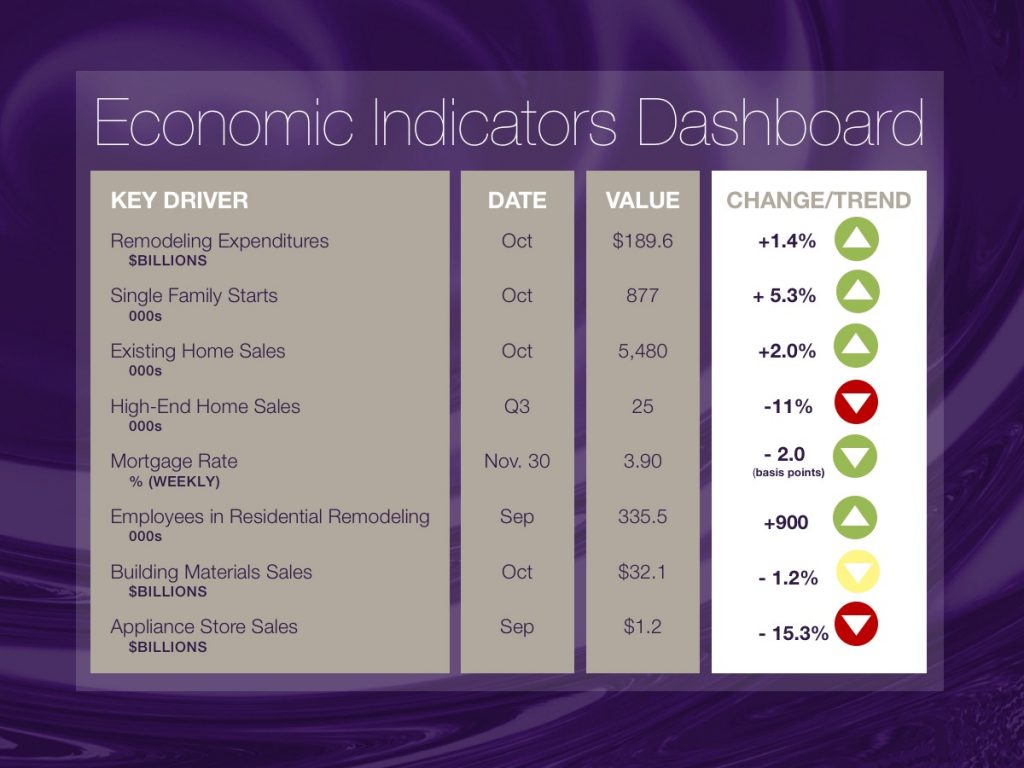
Explanation of NKBA’s Economic Indicators Dashboard
The dashboard displays the latest value of each economic indicator with a colored triangle that highlights visually the recent trend for each of the drivers. “Green” is a positive signal, indicating that the latest value is improving; “Yellow,” as it’s commonly understood, denotes caution because the variable may be changing direction; “Red” indicates that the variable in question is declining, both in its current value and in relation to the recent past.
Note that all the data, except for “mortgage rate” and “appliance-store sales” are seasonally adjusted and are represented at annual rates.
Remodeling Expenditures. This is the amount of money spent on home improvement projects during the month in question. It covers all work done for privately owned homes (excludes rentals, etc.). The data are in billions of dollars and are issued monthly by the U.S. Department of Commerce.
Single-Family Starts. This is the number of single-family houses for which construction was started in the given month. The data are in thousands of houses and are issued monthly by the U.S. Department of Commerce.
Existing-Home Sales. These data are issued monthly by the National Association of Realtors, and capture the number of existing homes that were sold in the previous month.
High-End Home Sales. This series are sales of new homes priced at $750,000 and higher. The data are released quarterly by the U.S. Department of Commerce, and are not seasonally adjusted. Thus, a valid comparison is made to the same quarter of prior year.
Mortgage Rate. We have chosen the rate on 30-year conventional loans that is issued by the Federal Home Loan Mortgage Corporation (known popularly as Freddie Mac.) Although there are a large number of mortgage instruments available to consumers, this one is still the most commonly used.
Employees in Residential Remodeling. This indicator denotes the number of individuals employed in construction firms that do mostly residential remodeling work.
Building-Materials Sales. These data, released monthly by the Department of Commerce, capture total sales of building materials, regardless of whether consumers or contractors purchased them. However, we should caution that the data also includes sales to projects other than residential houses.
Appliance-Store Sales. This driver captures the monthly sales of stores that sell mostly household appliances; the data are stated at an annual rate. We should not confuse this driver with total appliance sales, since they are sold by other types of stores such as home centers, for instance.
We hope that you find this dashboard useful as a general guide to the state of our industry. Please contact us if you would like to see further detail.


