

Total retail sales fell in June by 0.2%, to $473.5 billion. Although the drop is negligible, it is the second consecutive month when sales declined. In fact, as can be seen in the chart below, retail sales have remained roughly the same for the last three months, Further, they have ranged between $471 billion and $475 billion since last December.
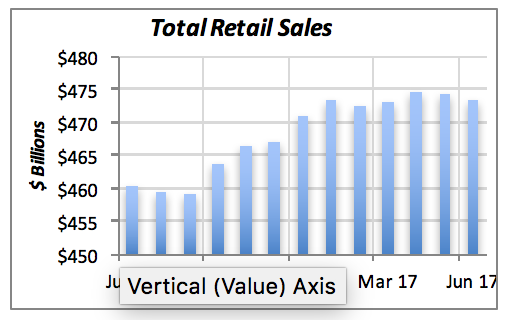
Retail sales rose for a few categories; most notably “motor vehicles and parts dealers,” which rose 0.1% in June to $93.4 billion. This is the biggest category contributing to retail sales, accounting for one fifth of U.S. retail sales.
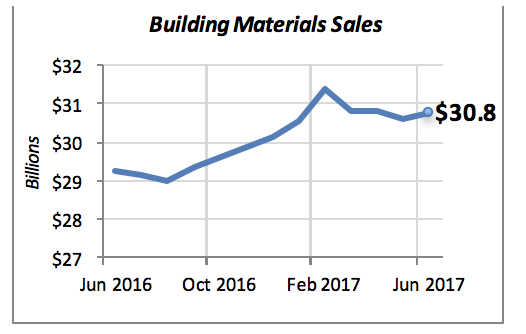
But in a welcome change, sales of building materials actually rose in June, to $30.8 billion. This gain reverses, if only partially, the losses seen in the previous three months. Sales of building materials had peaked at $31.4 billion back in February, and had dropped by 2.5% by May. But June’s increase brought sales to 2% from the peak.
Retail sales at appliance stores have not fared as well, however, and have been declining since the beginning of last year. The chart below displays sales, by month, for 2017 and the prior two years. Since the data are not seasonally adjusted, the only valid analysis is to compare a given month’s sales with those of the prior year.
We can readily see that 2017 sales, shown by the red line, have lagged behind those of the prior two years for each of the first five months of this year. In fact, May sales of $1.28 billion are nearly 9% lower than last year’s May sales. Further, they are more than 15% below May 2015 sales.
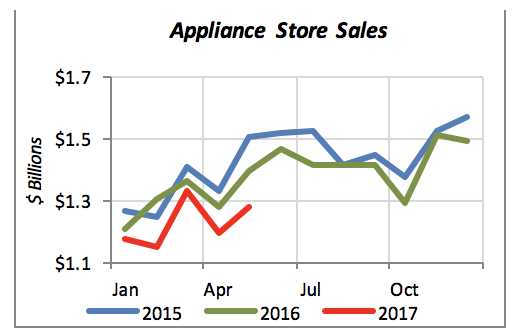
Note that this data reflects sales at appliance stores, and does not include sales at home improvement centers which compete directly with appliance stores.
On a different news front, the Department of Commerce revealed that the U.S. trade deficit improved slightly in May to $46.5 billion. But this modest improvement does little to counter the worsening trend in U.S. trade.
The chart below displays the monthly trade balance back to January 2012. For ease of interpretation, we have ignored the negative signs since the U.S. deficit has been in the red for many years now. That is, the $46.5 billion figure in the chart indicates that the balance in May was a negative $46.5 billion. The red line in the chart displays the 12-month moving average in the trade balance.
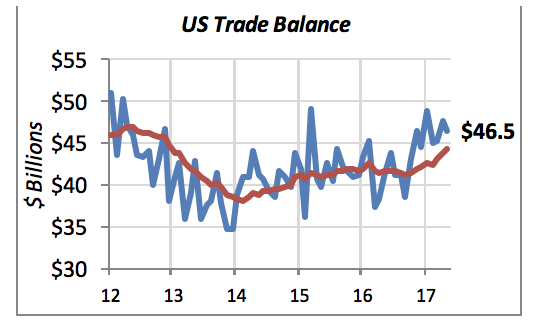
The rise in the red line since 2014 clearly illustrates the generally worsening trade balance since that year.
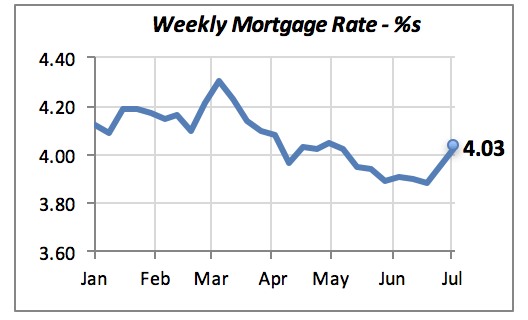
Mortgage rates rose last week to 4.03%. Although the increase is only 7 basis points, the trend is not favorable to housing markets. The stricter position that the Fed is taking on interest rates, sending signals that it will affect further increases in the Federal Funds rate, the more likely it is that we will see mortgage rate increases in the next few months.
Manuel Gutierrez, Consulting Economist to NKBA
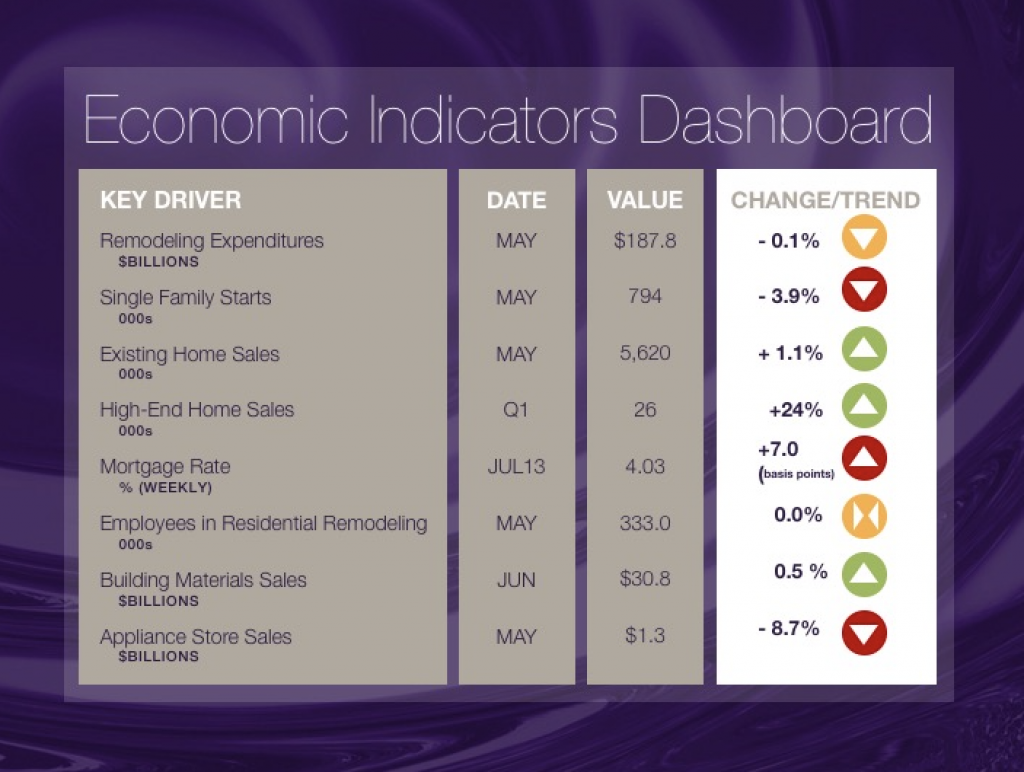
Explanation of NKBA’s Economic Indicators Dashboard
The dashboard displays the latest value of each economic indicator with a colored triangle that highlights visually the recent trend for each of the drivers. “Green” is a positive signal indicating that the latest value is improving; “Yellow,” as it’s commonly understood denotes caution because the variable might be changing direction; and “Red” indicates that the variable in question is declining, both in its current value and in relation to the recent past.
Note that all the data, except for “mortgage rate” and “appliance store sales” are seasonally adjusted and are represented at annual rates.
Remodeling Expenditures. This is the amount of money spent on home improvement projects during the month in question. It covers all work done for privately owned homes (excludes rentals, etc.). The data are in billions of dollars and are issued monthly by the U.S. Department of Commerce.
Single Family Starts. It is the number of single family houses for which construction was started in the given month. The data are in thousands of houses and are issued monthly by the U.S. Department of Commerce.
Existing Home Sales. These data are issued monthly by the National Association of Realtors, and capture the number of existing homes that were sold in the previous month.
High-End Home Sales. This series are sales of new homes priced at $750,000 and over. The data are released quarterly by the U.S. Department of Commerce, and are not seasonally adjusted. Thus a valid comparison is made to the same quarter of the prior year.
Mortgage Rate. We have chosen the rate on 30-year conventional loans that is issued by the Federal Home Loan Mortgage Corporation (known popularly as Freddie Mac.) Although there are a large number of mortgage instruments available to consumers, this one is still the most commonly used.
Employees in Residential Remodeling. This indicator denotes the number of individuals employed in construction firms that do mostly residential remodeling work.
Building Materials Sales. These data, released monthly by the Department of Commerce, capture the total sales of building materials, regardless of whether consumers or contractors purchased them. However, we should caution that the data also includes sales to projects other than residential houses.
Appliance Store Sales. This driver captures the monthly sales of stores that sell mostly household appliances; the data are stated at an annual rate. We should not confuse this driver with total appliance sales, since they are sold by other types of stores such as Home Centers, for instance.
We hope that you find this dashboard useful as a general guide to the state of our industry. Please contact us if you would like to see further detail.


